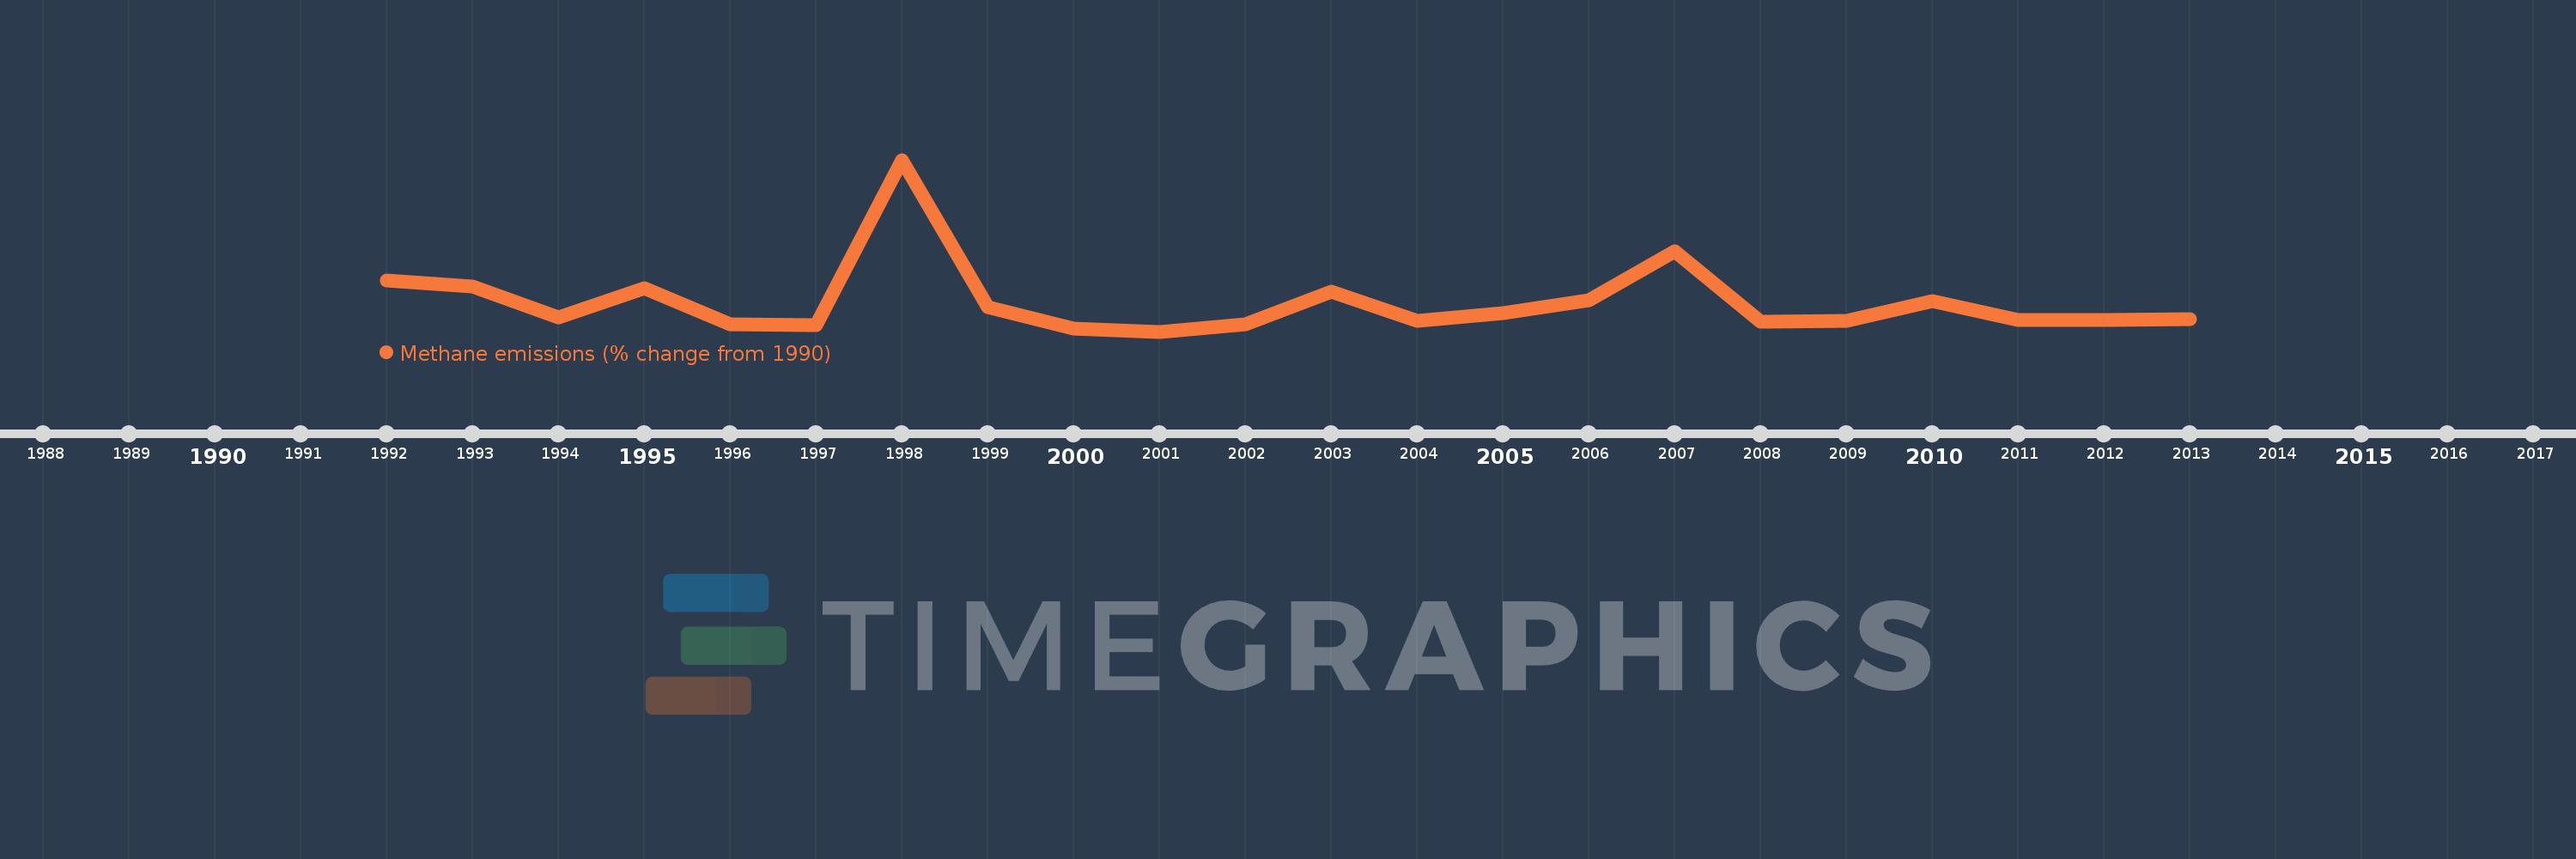
Questa scala temporale mostra un grafico dal 1992 anno al 2013 anno. Indonesia. I dati fino ad 1991 anno non disponibili. Il numero di osservazioni attuali secondo i date: 22.
La fonte (nome):
Indicatori dello sviluppo mondiale
La fonte (organizzazione):
World Bank staff estimates from original source: European Commission, Joint Research Centre (JRC)/Netherlands Environmental Assessment Agency (PBL). Emission Database for Global Atmospheric Research (EDGAR): http://edgar.jrc.ec.europa.eu/.
Categorie:
Climate Change, Environment
sono stati aggiornati
23 apr 2017 anni
Indicatori delle variazioni dei valori per anni
In media:
39.967
Minima:
-19.618
1 gen 2001 anni
Massimo:
331.548
1 gen 1998 anni
Alla data di osservazione
Valore
Variazione assoluta
La variazione rispetto al valore precedente
1 gen 1992 anni
84.869
+84.869
0.0%
1 gen 1993 anni
72.381
-12.488
-14.71%
1 gen 1994 anni
8.628
-63.753
-88.08%
1 gen 1995 anni
69.038
+60.41
700.15%
1 gen 1996 anni
-5.391
-74.429
-107.81%
1 gen 1997 anni
-7.208
-1.817
33.7%
1 gen 1998 anni
331.548
+338.756
-4.7 Mille.%
1 gen 1999 anni
30.816
-300.731
-90.71%
1 gen 2000 anni
-13.99
-44.806
-145.4%
1 gen 2001 anni
-19.618
-5.628
40.23%
1 gen 2002 anni
-3.876
+15.743
-80.25%
1 gen 2003 anni
61.926
+65.802
-1.7 Mille.%
1 gen 2004 anni
2.341
-59.585
-96.22%
1 gen 2005 anni
18.389
+16.048
685.5%
1 gen 2006 anni
45.347
+26.958
146.6%
1 gen 2007 anni
143.91
+98.563
217.35%
1 gen 2008 anni
1.32
-142.59
-99.08%
1 gen 2009 anni
2.083
+0.763
57.81%
1 gen 2010 anni
43.16
+41.077
1.97 Mille.%
1 gen 2011 anni
3.501
-39.659
-91.89%
1 gen 2012 anni
4.536
+1.035
29.56%
1 gen 2013 anni
5.571
+1.035
22.82%
Classificazione dei paesi secondo i statistiche attuali per anni