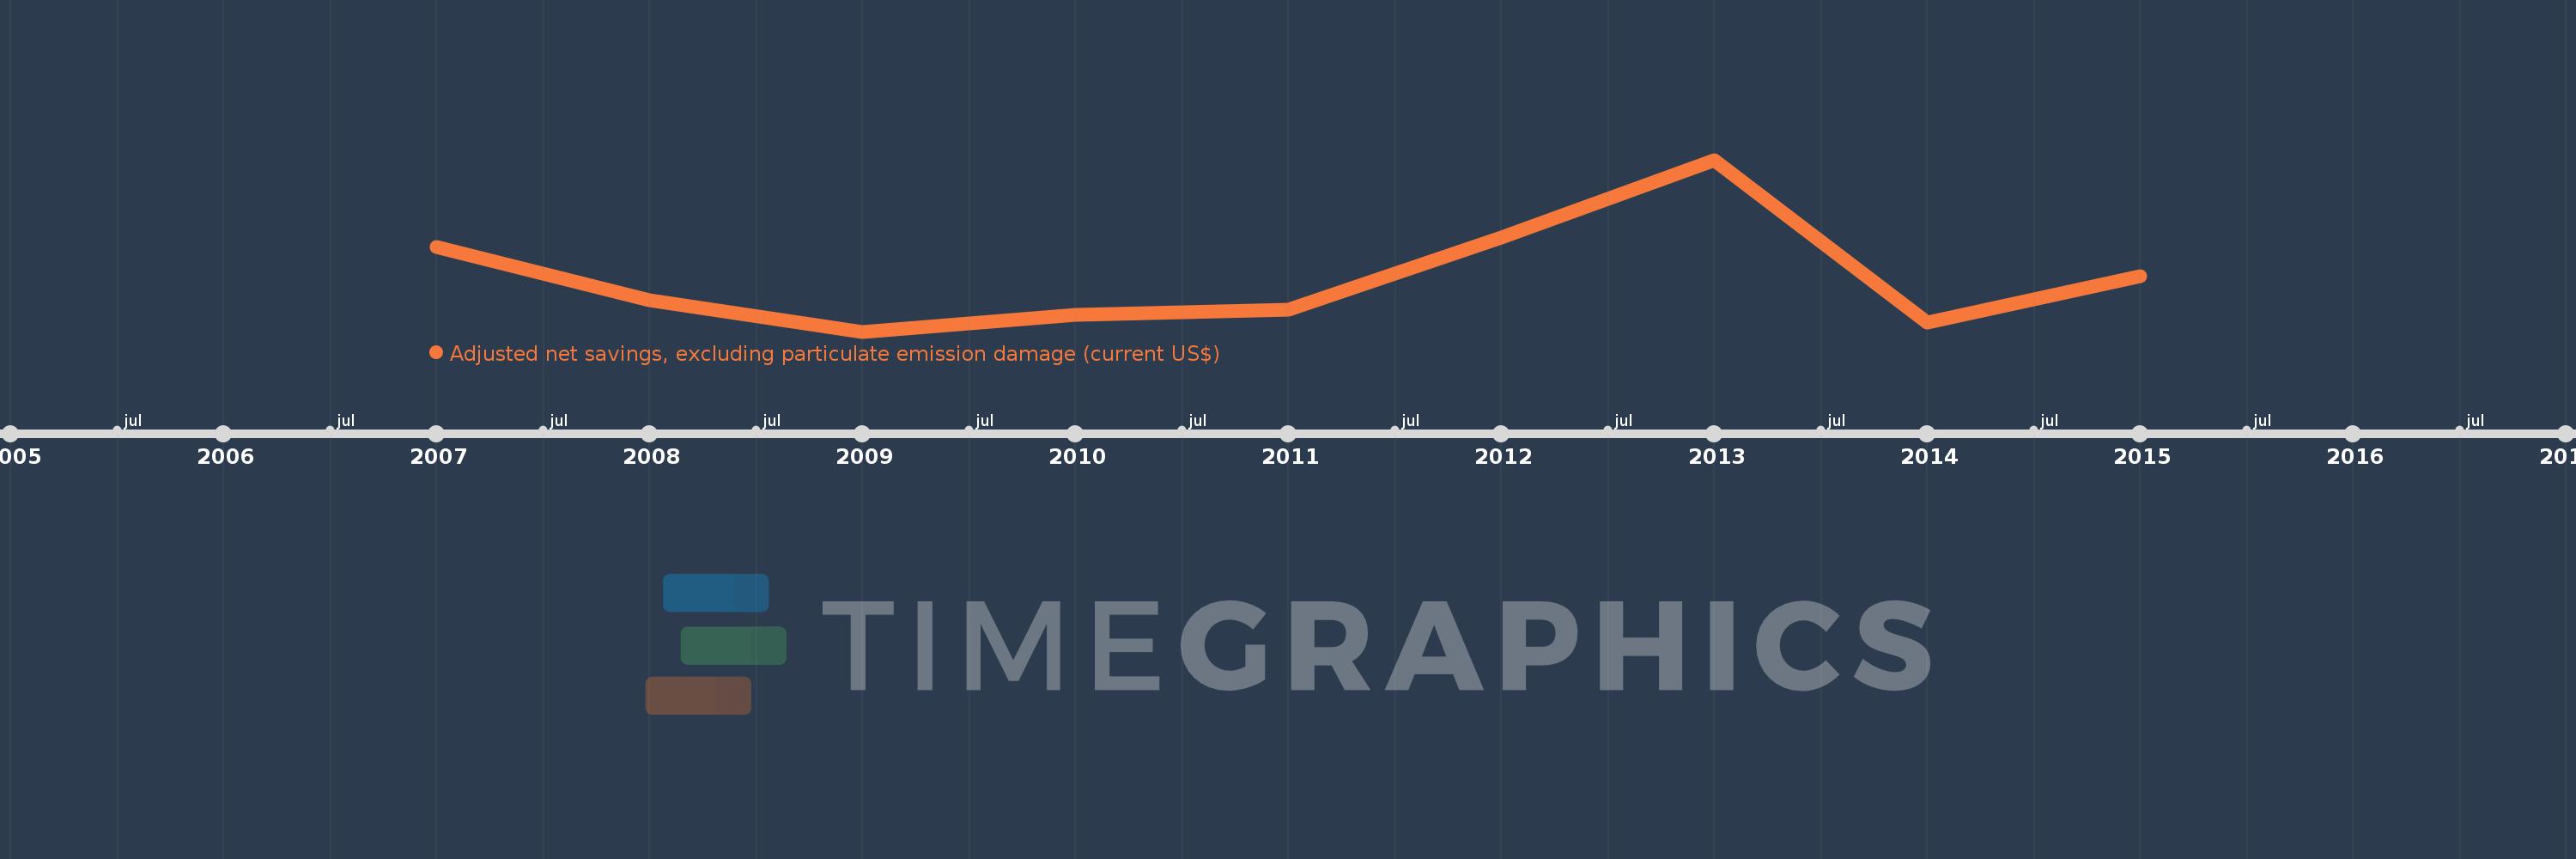
Questa scala temporale mostra un grafico dal 2007 anno al 2015 anno. Bhutan. I dati fino ad 2006 anno non disponibili. Il numero di osservazioni attuali secondo i date: 9.
La fonte (nome):
Indicatori dello sviluppo mondiale
La fonte (organizzazione):
World Bank staff estimates based on sources and methods in World Bank's "The Changing Wealth of Nations: Measuring Sustainable Development in the New Millennium" (2011).
Categorie:
Economy & Growth, Environment
sono stati aggiornati
23 apr 2017 anni
Indicatori delle variazioni dei valori per anni
In media:
281.246 Mln
Minima:
155.172 Mln
1 gen 2009 anni
Massimo:
557.592 Mln
1 gen 2013 anni
Alla data di osservazione
Valore
Variazione assoluta
La variazione rispetto al valore precedente
1 gen 2007 anni
352.737 Mln
+352.737 Mln
0.0%
1 gen 2008 anni
228.75 Mln
-123.988 Mln
-35.15%
1 gen 2009 anni
155.172 Mln
-73.578 Mln
-32.17%
1 gen 2010 anni
193.552 Mln
+38.38 Mln
24.73%
1 gen 2011 anni
206.782 Mln
+13.23 Mln
6.84%
1 gen 2012 anni
374.932 Mln
+168.15 Mln
81.32%
1 gen 2013 anni
557.592 Mln
+182.661 Mln
48.72%
1 gen 2014 anni
176.613 Mln
-380.979 Mln
-68.33%
1 gen 2015 anni
285.086 Mln
+108.473 Mln
61.42%
Classificazione dei paesi secondo i statistiche attuali per anni