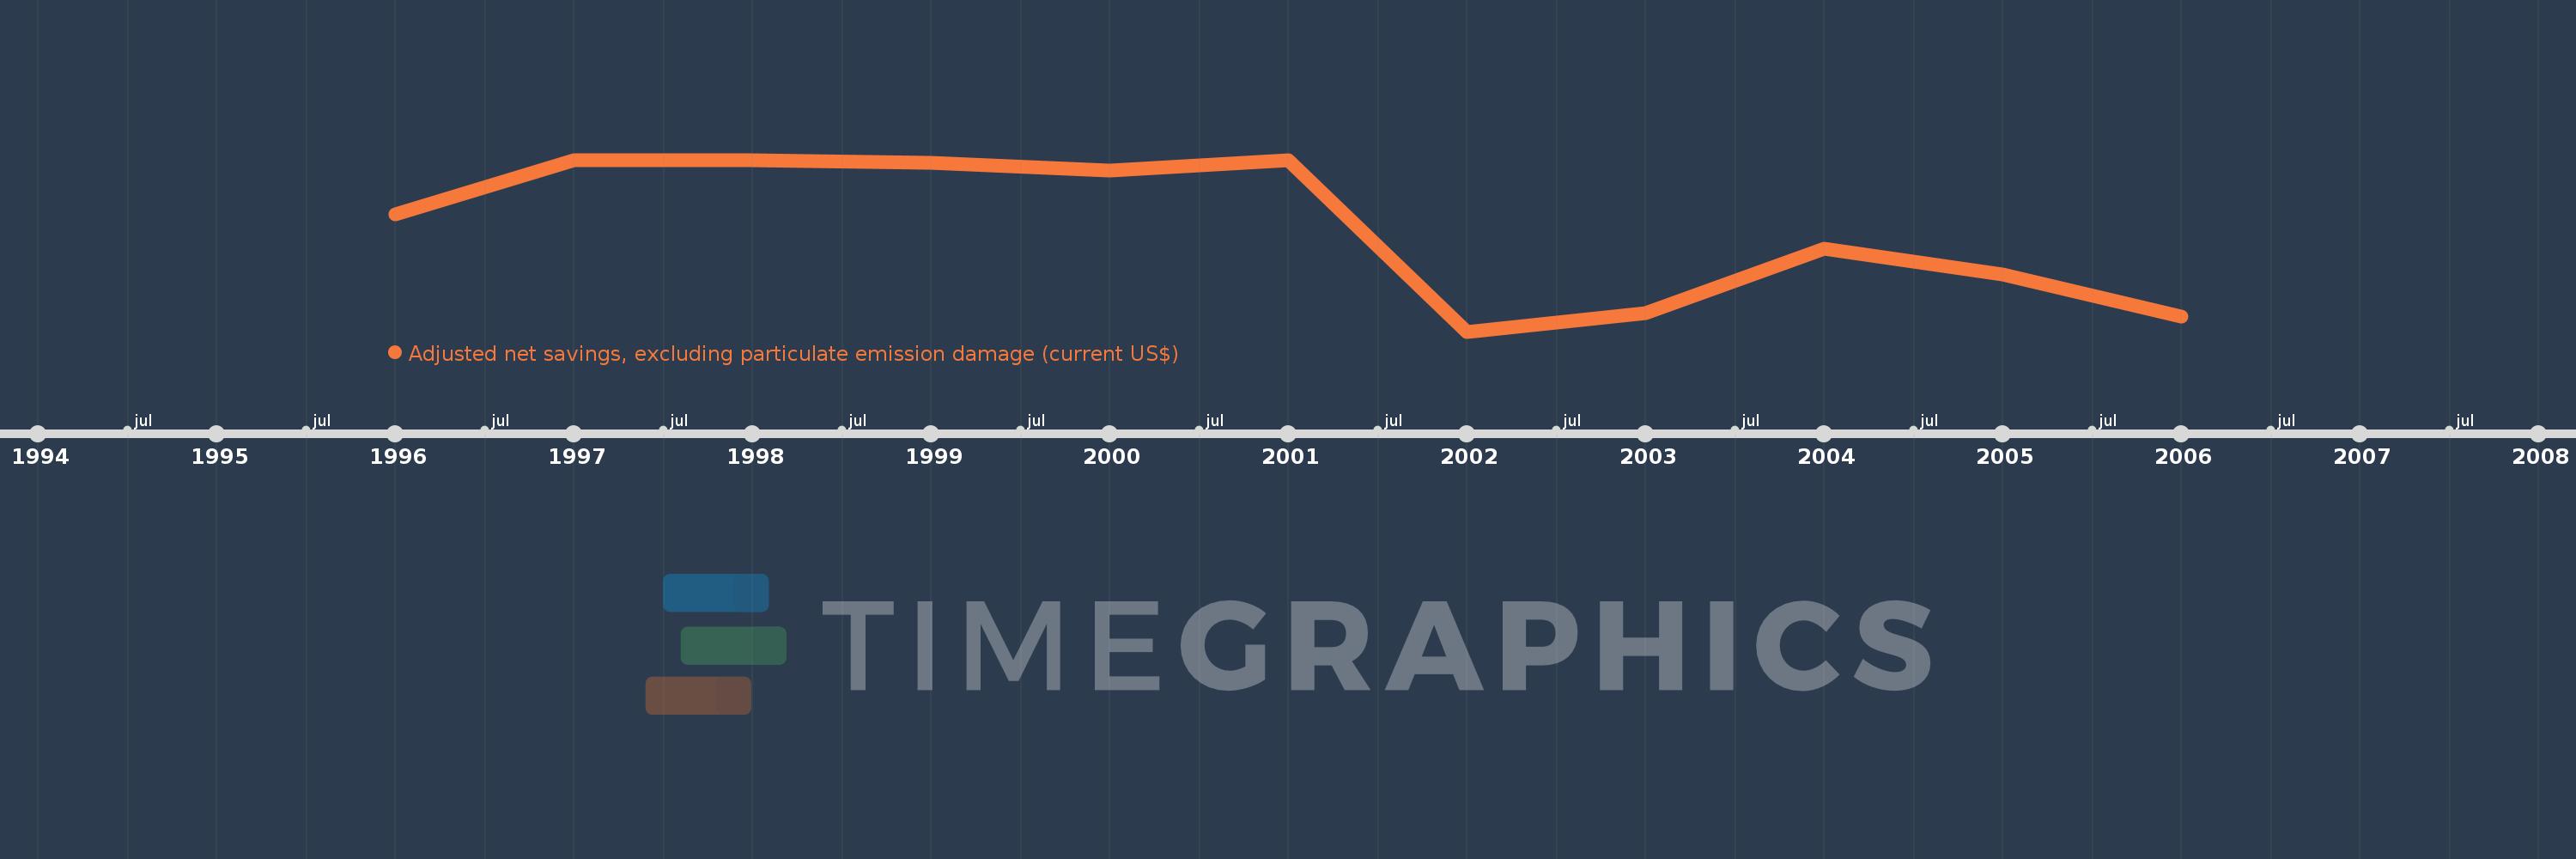
Questa scala temporale mostra un grafico dal 1996 anno al 2006 anno. Maldives. I dati fino ad 1995 anno non disponibili. Il numero di osservazioni attuali secondo i date: 11.
La fonte (nome):
Indicatori dello sviluppo mondiale
La fonte (organizzazione):
World Bank staff estimates based on sources and methods in World Bank's "The Changing Wealth of Nations: Measuring Sustainable Development in the New Millennium" (2011).
Categorie:
Economy & Growth, Environment
sono stati aggiornati
23 apr 2017 anni
Indicatori delle variazioni dei valori per anni
In media:
152.074 Mln
Minima:
84.309 Mln
1 gen 2002 anni
Massimo:
197.186 Mln
1 gen 2001 anni
Alla data di osservazione
Valore
Variazione assoluta
La variazione rispetto al valore precedente
1 gen 1996 anni
161.102 Mln
+161.102 Mln
0.0%
1 gen 1997 anni
196.862 Mln
+35.76 Mln
22.2%
1 gen 1998 anni
196.692 Mln
-169.212 Mille.
-0.09%
1 gen 1999 anni
195.391 Mln
-1.301 Mln
-0.66%
1 gen 2000 anni
190.142 Mln
-5.249 Mln
-2.69%
1 gen 2001 anni
197.186 Mln
+7.044 Mln
3.7%
1 gen 2002 anni
84.309 Mln
-112.877 Mln
-57.24%
1 gen 2003 anni
96.436 Mln
+12.126 Mln
14.38%
1 gen 2004 anni
138.855 Mln
+42.419 Mln
43.99%
1 gen 2005 anni
121.721 Mln
-17.133 Mln
-12.34%
1 gen 2006 anni
94.113 Mln
-27.608 Mln
-22.68%
Classificazione dei paesi secondo i statistiche attuali per anni