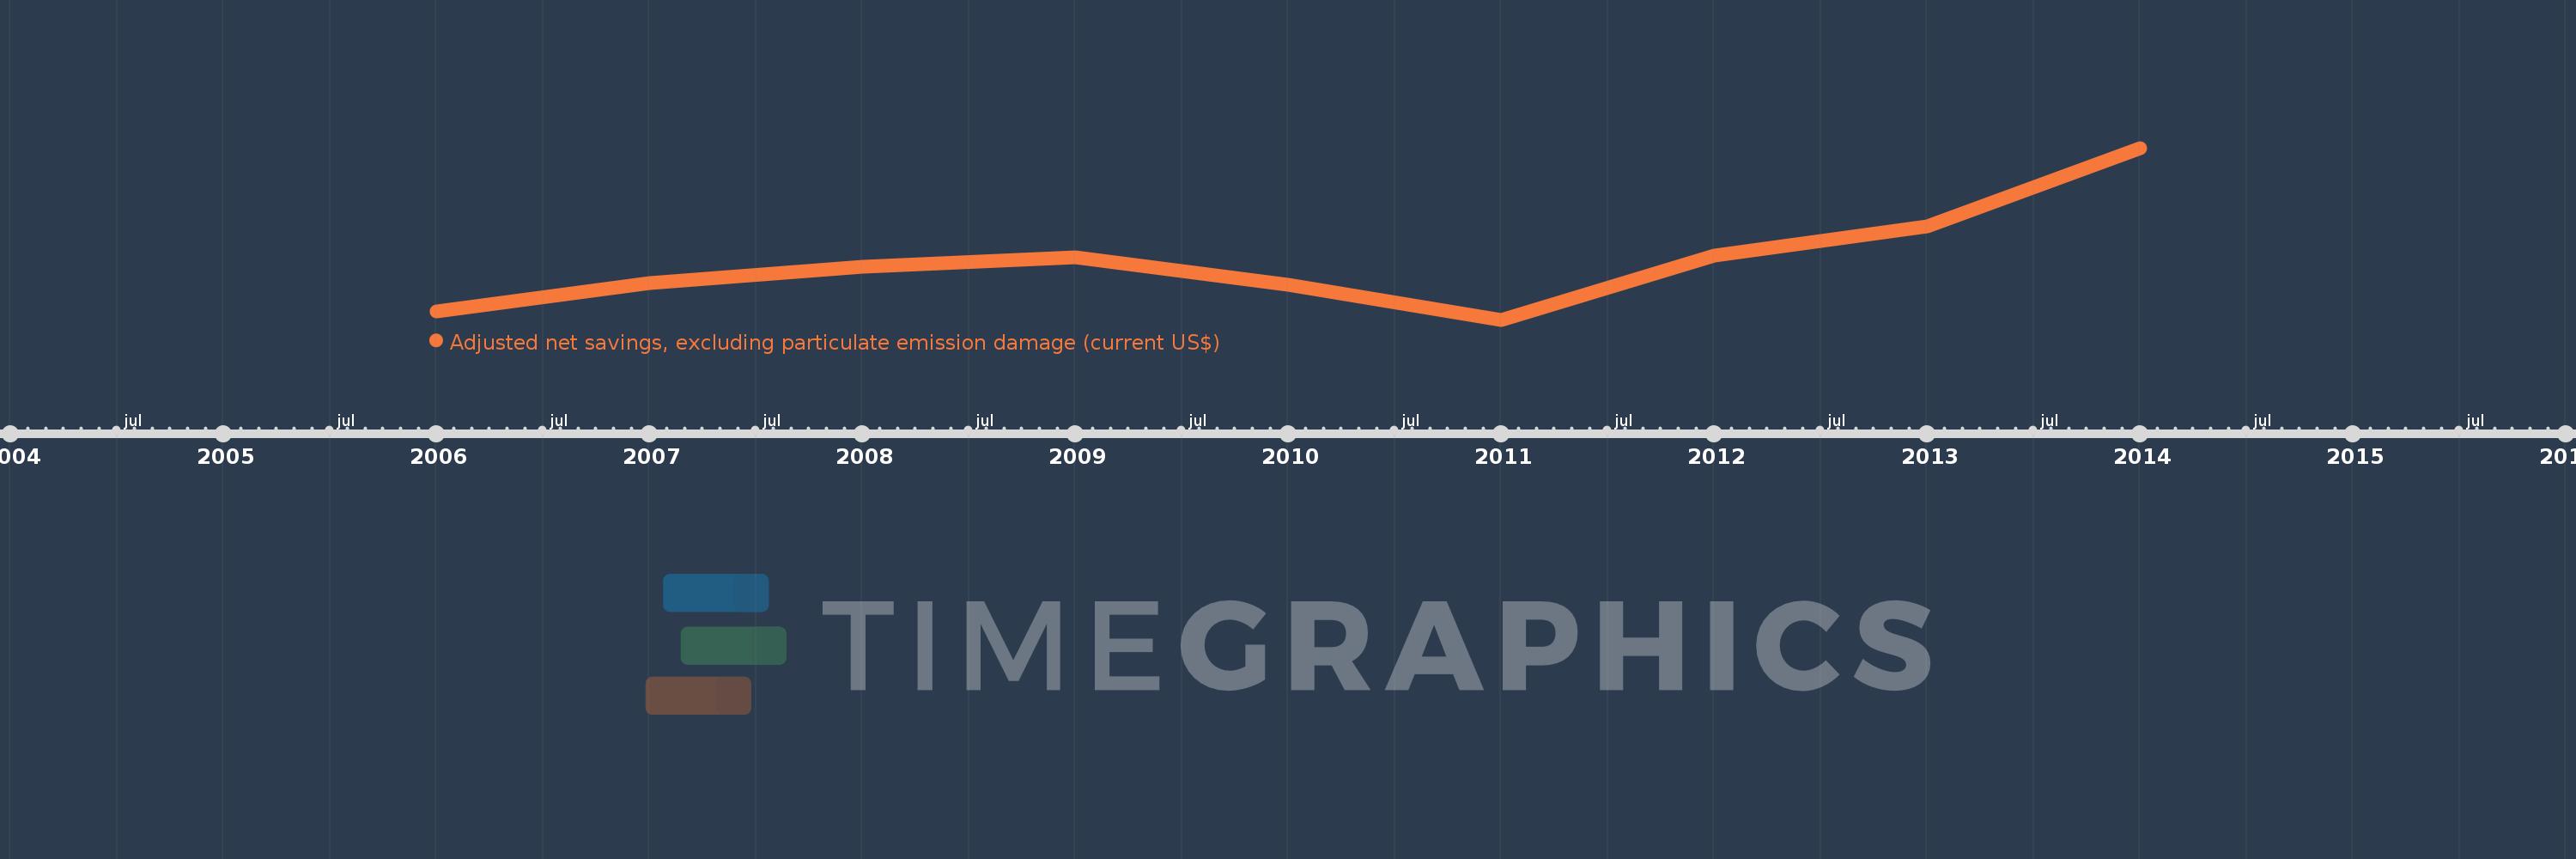
Questa scala temporale mostra un grafico dal 2006 anno al 2014 anno. Lesotho. I dati fino ad 2005 anno non disponibili. Il numero di osservazioni attuali secondo i date: 9.
La fonte (nome):
Indicatori dello sviluppo mondiale
La fonte (organizzazione):
World Bank staff estimates based on sources and methods in World Bank's "The Changing Wealth of Nations: Measuring Sustainable Development in the New Millennium" (2011).
Categorie:
Economy & Growth, Environment
sono stati aggiornati
23 apr 2017 anni
Indicatori delle variazioni dei valori per anni
In media:
467.75 Mln
Minima:
261.233 Mln
1 gen 2011 anni
Massimo:
870.869 Mln
1 gen 2014 anni
Alla data di osservazione
Valore
Variazione assoluta
La variazione rispetto al valore precedente
1 gen 2006 anni
290.741 Mln
+290.741 Mln
0.0%
1 gen 2007 anni
389.966 Mln
+99.225 Mln
34.13%
1 gen 2008 anni
449.24 Mln
+59.275 Mln
15.2%
1 gen 2009 anni
481.973 Mln
+32.732 Mln
7.29%
1 gen 2010 anni
384.055 Mln
-97.917 Mln
-20.32%
1 gen 2011 anni
261.233 Mln
-122.823 Mln
-31.98%
1 gen 2012 anni
489.568 Mln
+228.335 Mln
87.41%
1 gen 2013 anni
592.11 Mln
+102.542 Mln
20.95%
1 gen 2014 anni
870.869 Mln
+278.759 Mln
47.08%
Classificazione dei paesi secondo i statistiche attuali per anni