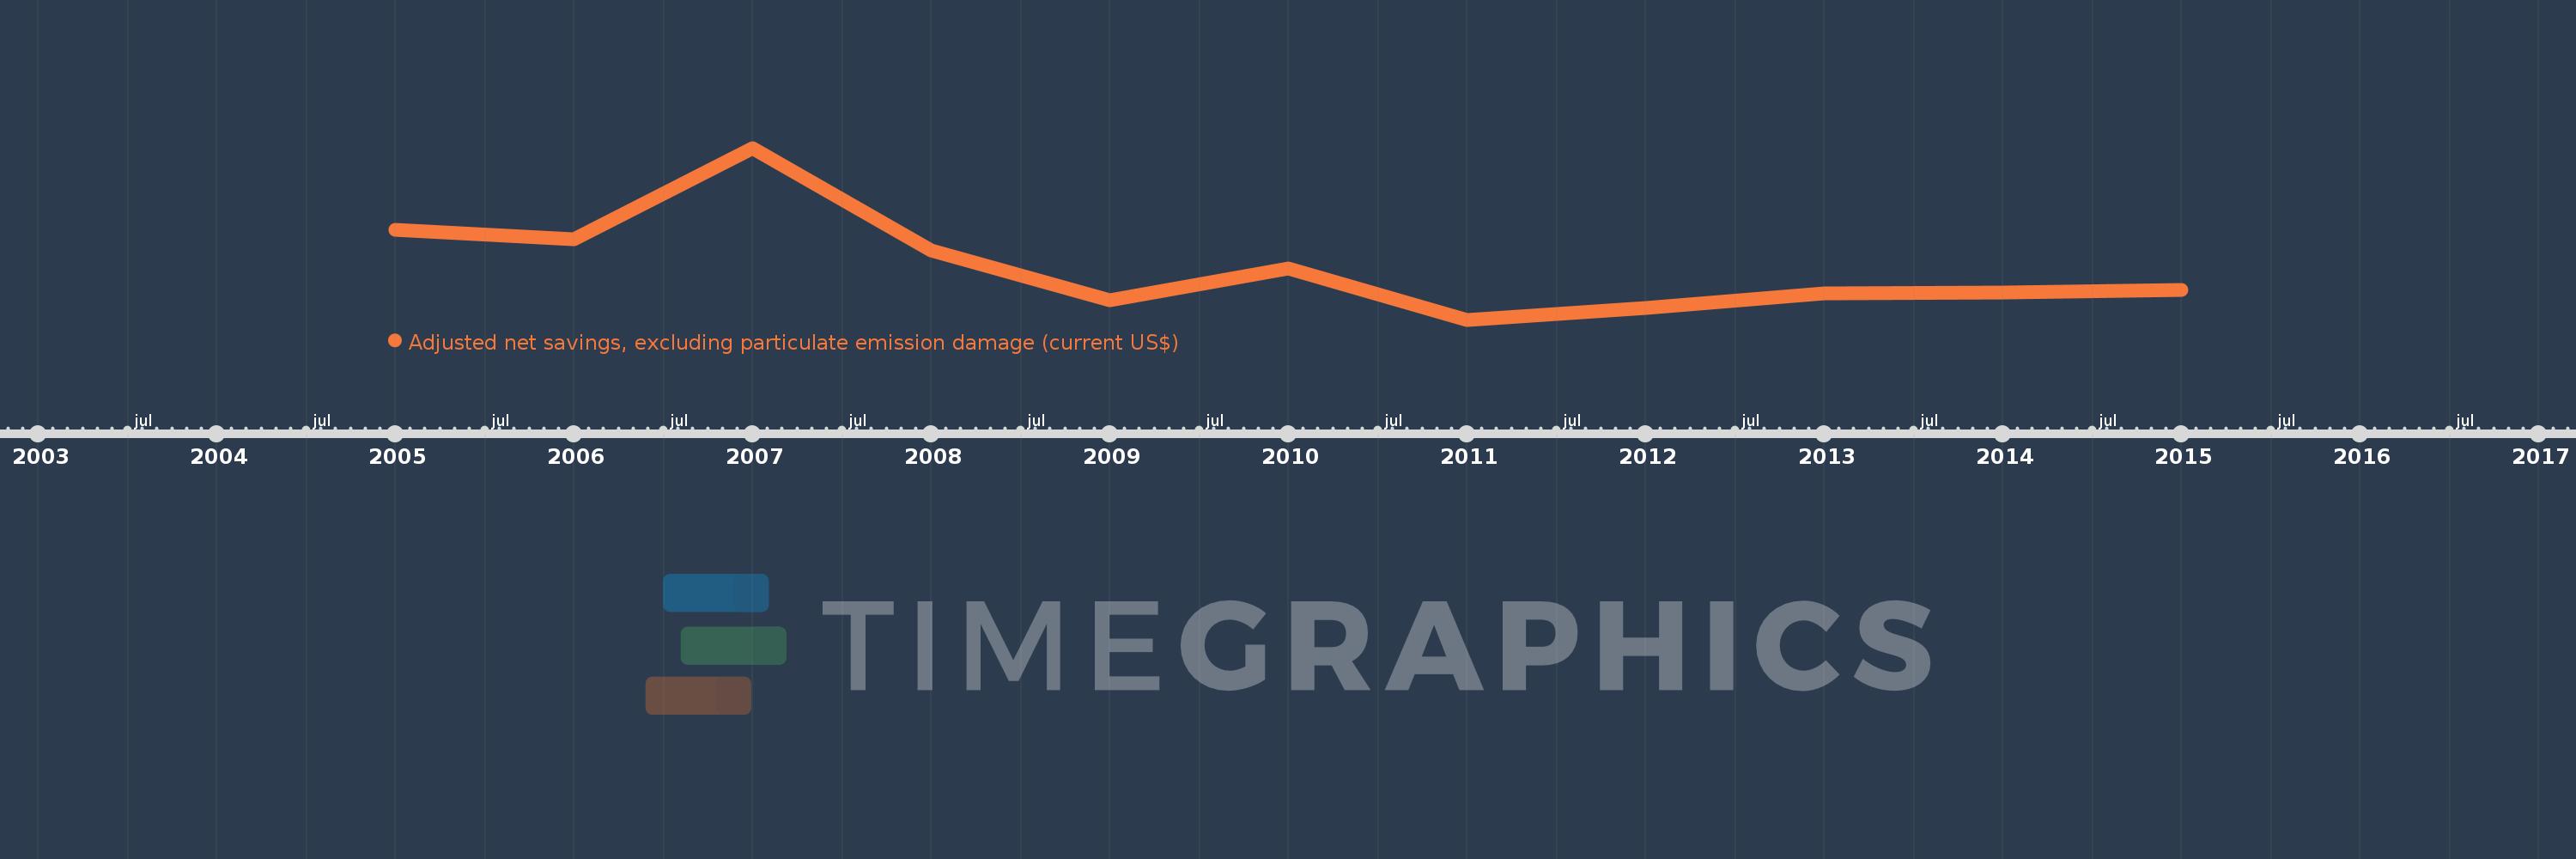
Questa scala temporale mostra un grafico dal 2005 anno al 2015 anno. Liberia. I dati fino ad 2004 anno non disponibili. Il numero di osservazioni attuali secondo i date: 11.
La fonte (nome):
Indicatori dello sviluppo mondiale
La fonte (organizzazione):
World Bank staff estimates based on sources and methods in World Bank's "The Changing Wealth of Nations: Measuring Sustainable Development in the New Millennium" (2011).
Categorie:
Economy & Growth, Environment
sono stati aggiornati
23 apr 2017 anni
Indicatori delle variazioni dei valori per anni
In media:
-311.087 Mln
Minima:
-631.855 Mln
1 gen 2011 anni
Massimo:
416.8 Mln
1 gen 2007 anni
Alla data di osservazione
Valore
Variazione assoluta
La variazione rispetto al valore precedente
1 gen 2005 anni
-83.319 Mln
-83.319 Mln
0.0%
1 gen 2006 anni
-141.33 Mln
-58.01 Mln
69.62%
1 gen 2007 anni
416.8 Mln
+558.13 Mln
-394.91%
1 gen 2008 anni
-206.321 Mln
-623.121 Mln
-149.5%
1 gen 2009 anni
-513.139 Mln
-306.818 Mln
148.71%
1 gen 2010 anni
-316.267 Mln
+196.872 Mln
-38.37%
1 gen 2011 anni
-631.855 Mln
-315.588 Mln
99.79%
1 gen 2012 anni
-558.9 Mln
+72.955 Mln
-11.55%
1 gen 2013 anni
-473.012 Mln
+85.888 Mln
-15.37%
1 gen 2014 anni
-467.032 Mln
+5.98 Mln
-1.26%
1 gen 2015 anni
-447.586 Mln
+19.445 Mln
-4.16%
Classificazione dei paesi secondo i statistiche attuali per anni