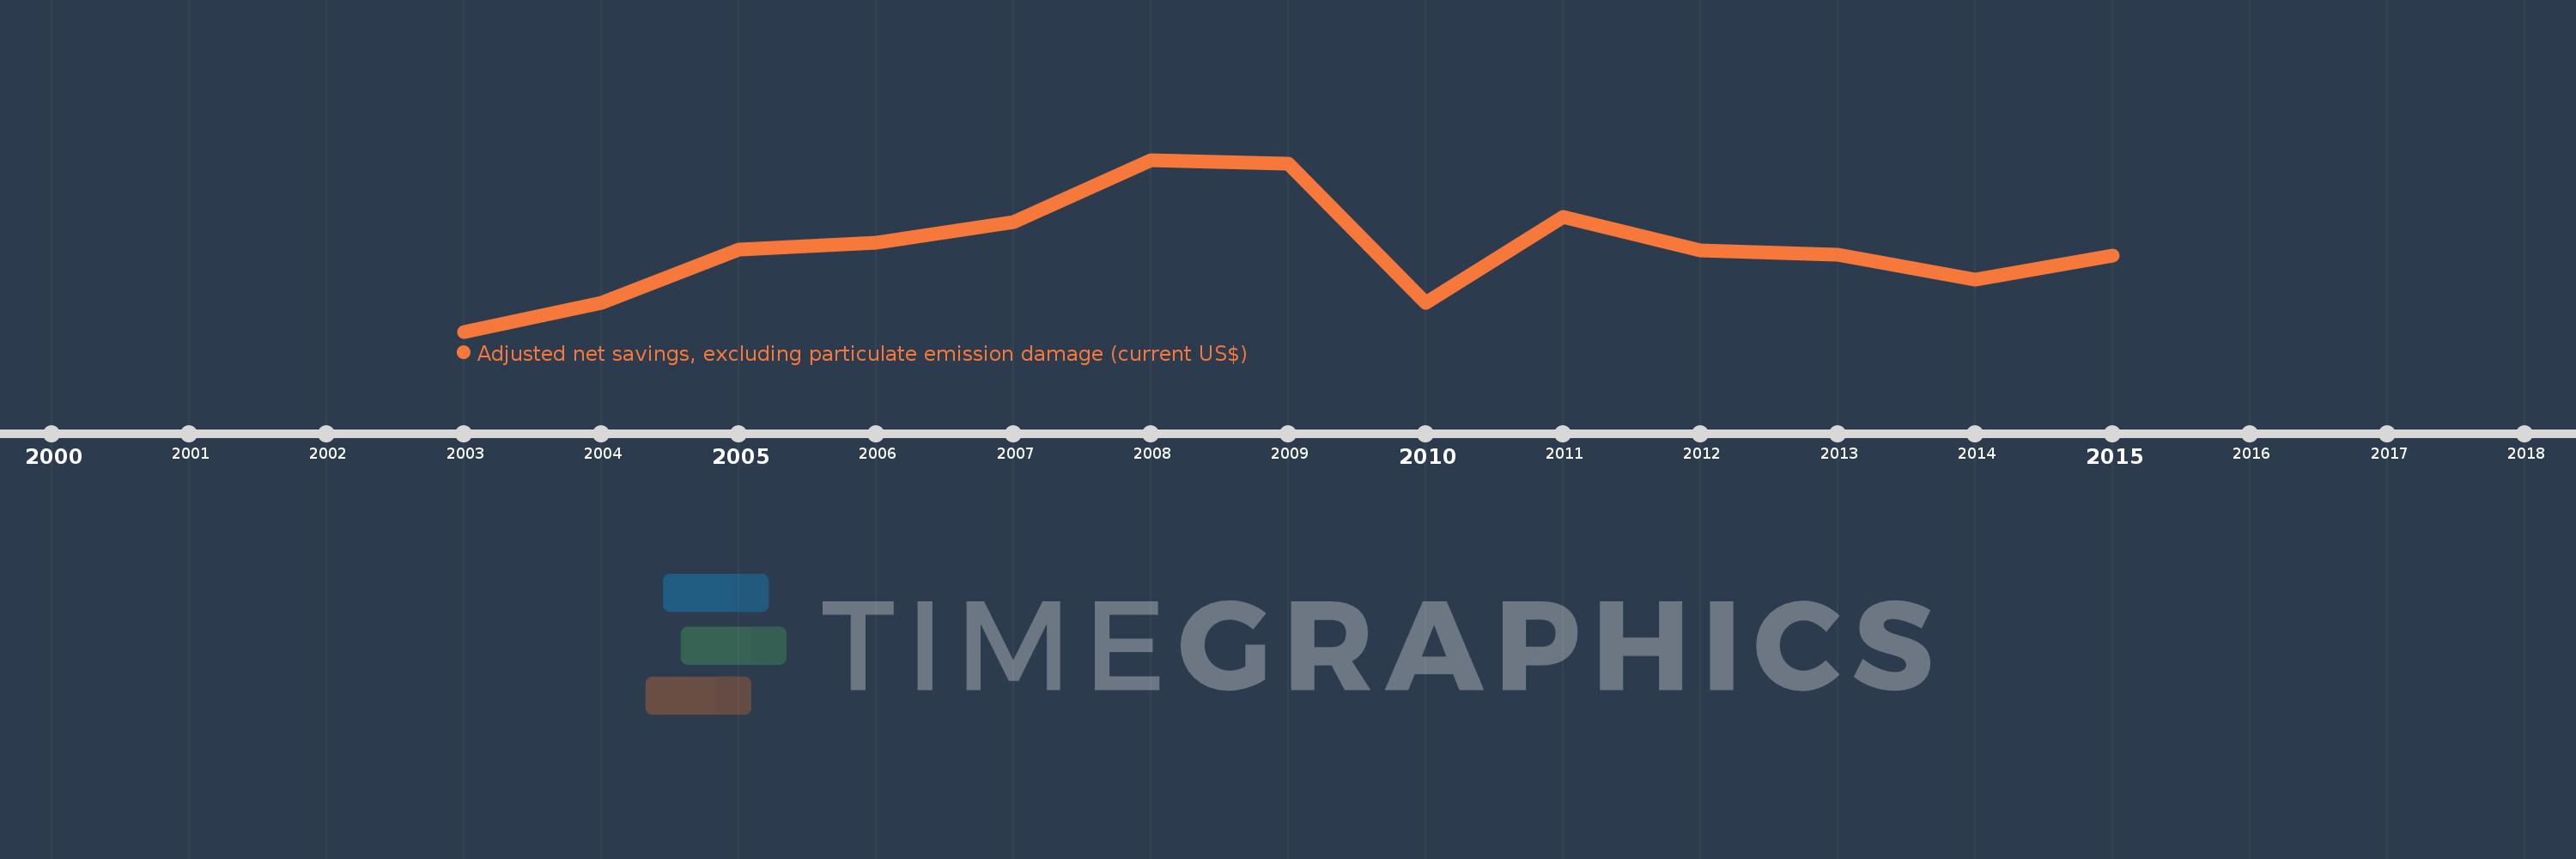
Questa scala temporale mostra un grafico dal 2003 anno al 2015 anno. Belgium. I dati fino ad 2002 anno non disponibili. Il numero di osservazioni attuali secondo i date: 13.
La fonte (nome):
Indicatori dello sviluppo mondiale
La fonte (organizzazione):
World Bank staff estimates based on sources and methods in World Bank's "The Changing Wealth of Nations: Measuring Sustainable Development in the New Millennium" (2011).
Categorie:
Economy & Growth, Environment
sono stati aggiornati
23 apr 2017 anni
Indicatori delle variazioni dei valori per anni
In media:
55.428 Mlrd
Minima:
37.822 Mlrd
1 gen 2003 anni
Massimo:
74.297 Mlrd
1 gen 2008 anni
Alla data di osservazione
Valore
Variazione assoluta
La variazione rispetto al valore precedente
1 gen 2003 anni
37.822 Mlrd
+37.822 Mlrd
0.0%
1 gen 2004 anni
43.921 Mlrd
+6.099 Mlrd
16.13%
1 gen 2005 anni
55.243 Mlrd
+11.322 Mlrd
25.78%
1 gen 2006 anni
56.746 Mlrd
+1.503 Mlrd
2.72%
1 gen 2007 anni
61.008 Mlrd
+4.263 Mlrd
7.51%
1 gen 2008 anni
74.297 Mlrd
+13.289 Mlrd
21.78%
1 gen 2009 anni
73.4 Mlrd
-896.5 Mln
-1.21%
1 gen 2010 anni
44.018 Mlrd
-29.383 Mlrd
-40.03%
1 gen 2011 anni
62.222 Mlrd
+18.205 Mlrd
41.36%
1 gen 2012 anni
54.977 Mlrd
-7.245 Mlrd
-11.64%
1 gen 2013 anni
54.227 Mlrd
-750.058 Mln
-1.36%
1 gen 2014 anni
48.79 Mlrd
-5.437 Mlrd
-10.03%
1 gen 2015 anni
53.899 Mlrd
+5.109 Mlrd
10.47%
Classificazione dei paesi secondo i statistiche attuali per anni