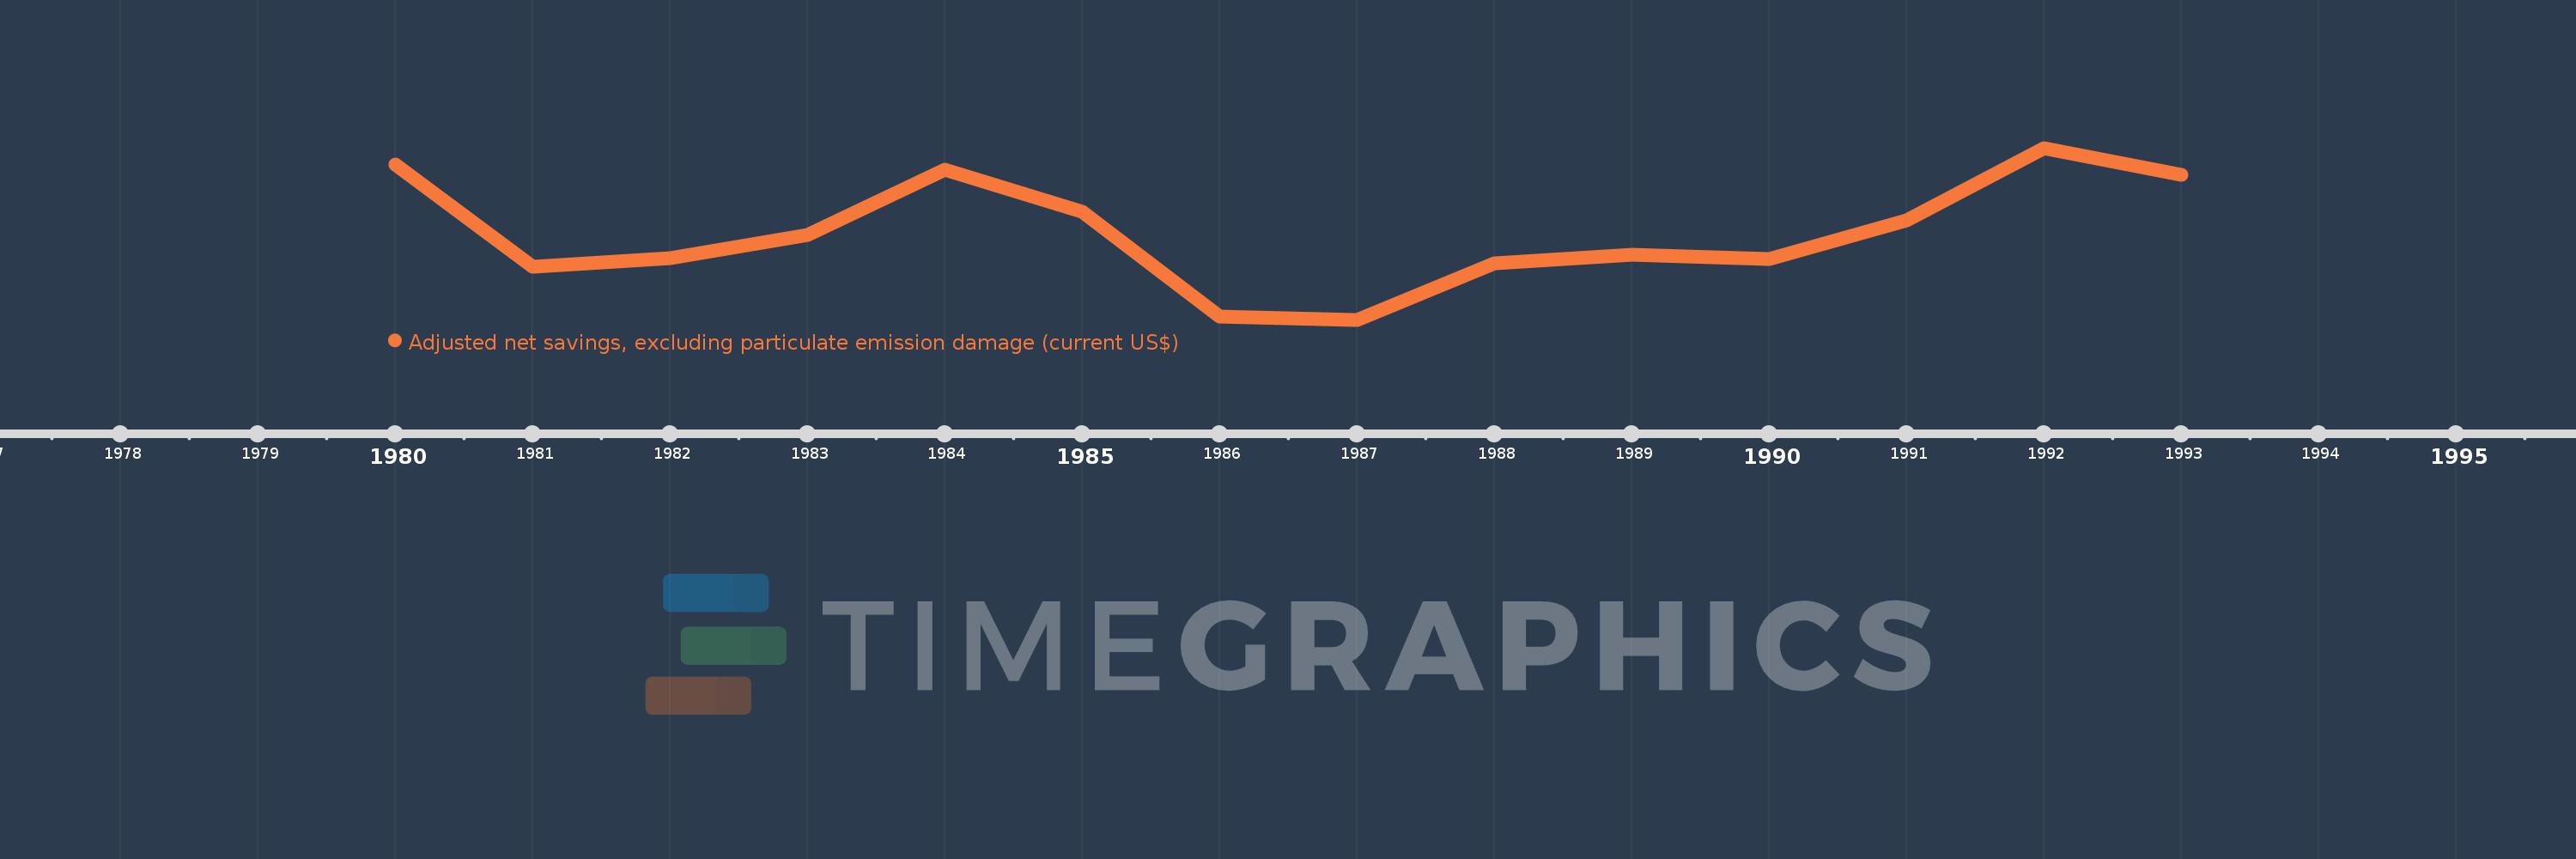
Questa scala temporale mostra un grafico dal 1980 anno al 1993 anno. Kiribati. I dati fino ad 1979 anno non disponibili. Il numero di osservazioni attuali secondo i date: 14.
La fonte (nome):
Indicatori dello sviluppo mondiale
La fonte (organizzazione):
World Bank staff estimates based on sources and methods in World Bank's "The Changing Wealth of Nations: Measuring Sustainable Development in the New Millennium" (2011).
Categorie:
Economy & Growth, Environment
sono stati aggiornati
23 apr 2017 anni
Indicatori delle variazioni dei valori per anni
In media:
16.058 Mln
Minima:
5.256 Mln
1 gen 1987 anni
Massimo:
26.623 Mln
1 gen 1992 anni
Alla data di osservazione
Valore
Variazione assoluta
La variazione rispetto al valore precedente
1 gen 1980 anni
24.535 Mln
+24.535 Mln
0.0%
1 gen 1981 anni
11.888 Mln
-12.647 Mln
-51.55%
1 gen 1982 anni
12.953 Mln
+1.065 Mln
8.96%
1 gen 1983 anni
15.844 Mln
+2.891 Mln
22.32%
1 gen 1984 anni
23.963 Mln
+8.12 Mln
51.25%
1 gen 1985 anni
18.687 Mln
-5.276 Mln
-22.02%
1 gen 1986 anni
5.644 Mln
-13.044 Mln
-69.8%
1 gen 1987 anni
5.256 Mln
-387.15 Mille.
-6.86%
1 gen 1988 anni
12.269 Mln
+7.012 Mln
133.41%
1 gen 1989 anni
13.379 Mln
+1.11 Mln
9.05%
1 gen 1990 anni
12.862 Mln
-516.471 Mille.
-3.86%
1 gen 1991 anni
17.571 Mln
+4.708 Mln
36.61%
1 gen 1992 anni
26.623 Mln
+9.052 Mln
51.52%
1 gen 1993 anni
23.332 Mln
-3.291 Mln
-12.36%
Classificazione dei paesi secondo i statistiche attuali per anni