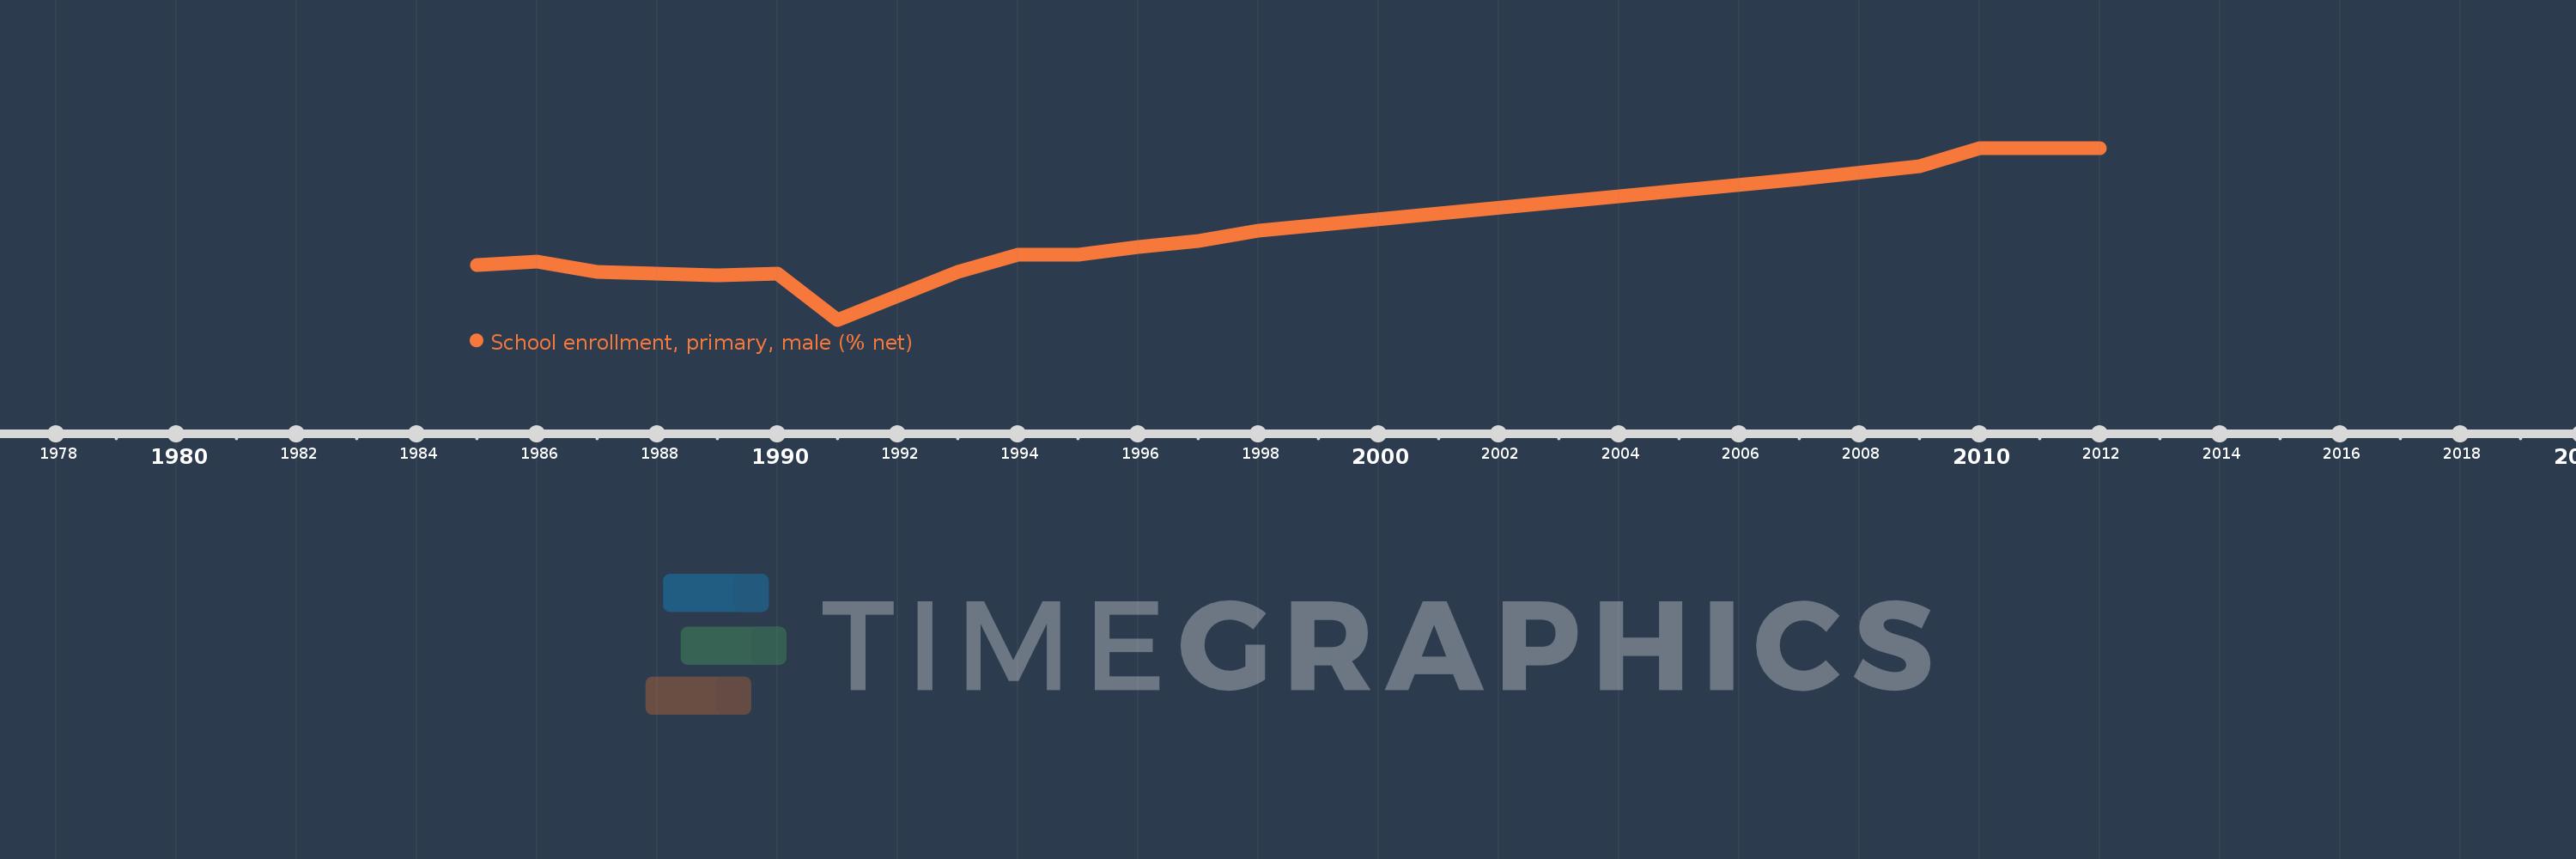
Questa scala temporale mostra un grafico dal 1985 anno al 2012 anno. Benin. I dati fino ad 1984 anno non disponibili. Il numero di osservazioni attuali secondo i date: 16.
La fonte (nome):
Indicatori dello sviluppo mondiale
La fonte (organizzazione):
United Nations Educational, Scientific, and Cultural Organization (UNESCO) Institute for Statistics.
Categorie:
Education, Gender
sono stati aggiornati
23 apr 2017 anni
Indicatori delle variazioni dei valori per anni
In media:
74.987
Minima:
52.361
1 gen 1991 anni
Massimo:
99.952
1 gen 2010 anni
Alla data di osservazione
Valore
Variazione assoluta
La variazione rispetto al valore precedente
1 gen 1985 anni
67.506
+67.506
0.0%
1 gen 1986 anni
68.372
+0.866
1.28%
1 gen 1987 anni
65.5
-2.873
-4.2%
1 gen 1989 anni
64.771
-0.729
-1.11%
1 gen 1990 anni
65.249
+0.478
0.74%
1 gen 1991 anni
52.361
-12.888
-19.75%
1 gen 1993 anni
65.716
+13.355
25.51%
1 gen 1994 anni
70.281
+4.565
6.95%
1 gen 1995 anni
70.291
+0.01
0.01%
1 gen 1996 anni
72.441
+2.15
3.06%
1 gen 1997 anni
74.26
+1.819
2.51%
1 gen 1998 anni
77.142
+2.882
3.88%
1 gen 2007 anni
91.282
+14.14
18.33%
1 gen 2009 anni
94.804
+3.522
3.86%
1 gen 2010 anni
99.952
+5.148
5.43%
1 gen 2012 anni
99.863
-0.089
-0.09%
Classificazione dei paesi secondo i statistiche attuali per anni