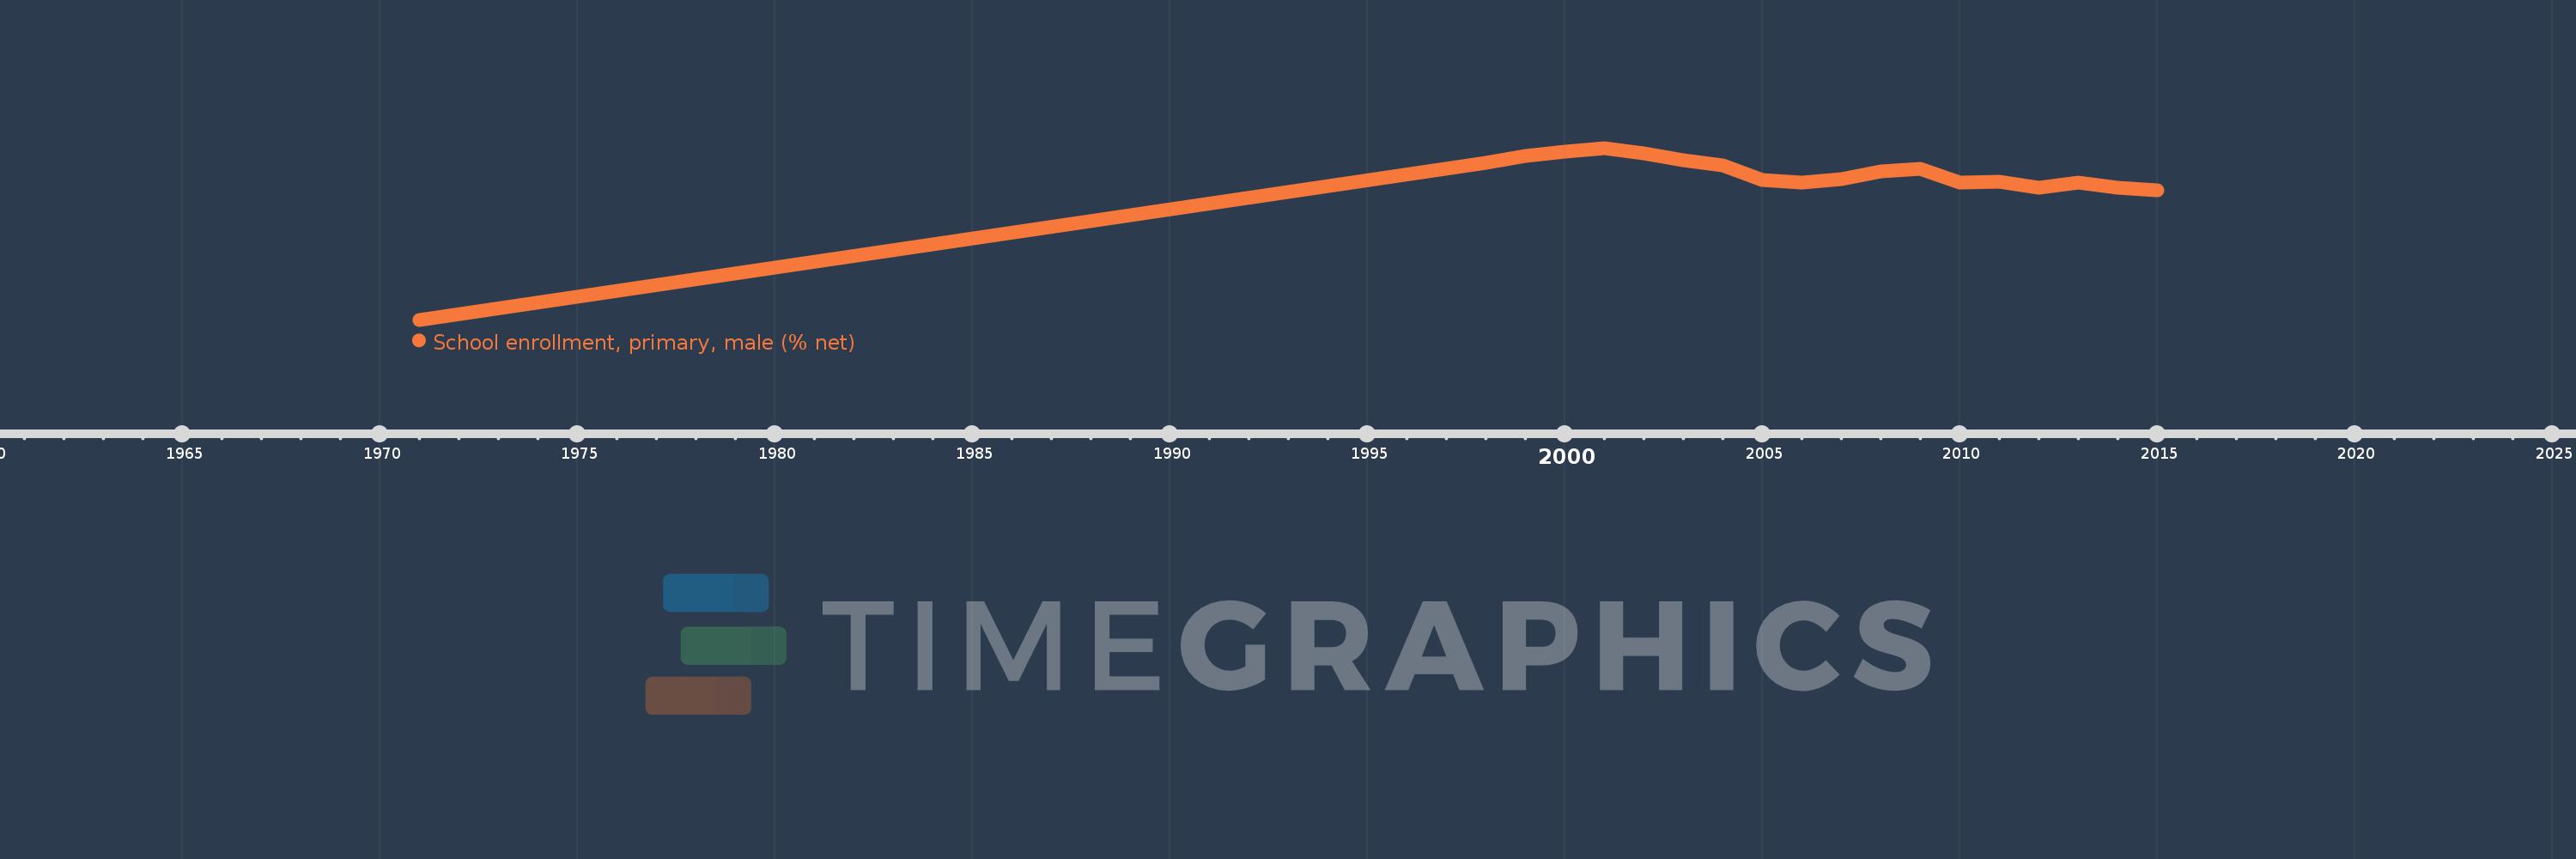
Questa scala temporale mostra un grafico dal 1971 anno al 2015 anno. OECD members. I dati fino ad 1970 anno non disponibili. Il numero di osservazioni attuali secondo i date: 19.
La fonte (nome):
Indicatori dello sviluppo mondiale
La fonte (organizzazione):
United Nations Educational, Scientific, and Cultural Organization (UNESCO) Institute for Statistics.
Categorie:
Education, Gender
sono stati aggiornati
23 apr 2017 anni
Indicatori delle variazioni dei valori per anni
In media:
96.248
Minima:
89.902
1 gen 1971 anni
Massimo:
97.681
1 gen 2001 anni
Alla data di osservazione
Valore
Variazione assoluta
La variazione rispetto al valore precedente
1 gen 1971 anni
89.902
+89.902
0.0%
1 gen 1998 anni
97.009
+7.107
7.91%
1 gen 1999 anni
97.303
+0.294
0.3%
1 gen 2000 anni
97.499
+0.195
0.2%
1 gen 2001 anni
97.681
+0.182
0.19%
1 gen 2002 anni
97.432
-0.249
-0.25%
1 gen 2003 anni
97.108
-0.324
-0.33%
1 gen 2004 anni
96.885
-0.223
-0.23%
1 gen 2005 anni
96.223
-0.662
-0.68%
1 gen 2006 anni
96.11
-0.113
-0.12%
1 gen 2007 anni
96.281
+0.171
0.18%
1 gen 2008 anni
96.62
+0.339
0.35%
1 gen 2009 anni
96.755
+0.135
0.14%
1 gen 2010 anni
96.101
-0.654
-0.68%
1 gen 2011 anni
96.156
+0.055
0.06%
1 gen 2012 anni
95.864
-0.292
-0.3%
1 gen 2013 anni
96.11
+0.246
0.26%
1 gen 2014 anni
95.898
-0.213
-0.22%
1 gen 2015 anni
95.769
-0.128
-0.13%
Classificazione dei paesi secondo i statistiche attuali per anni