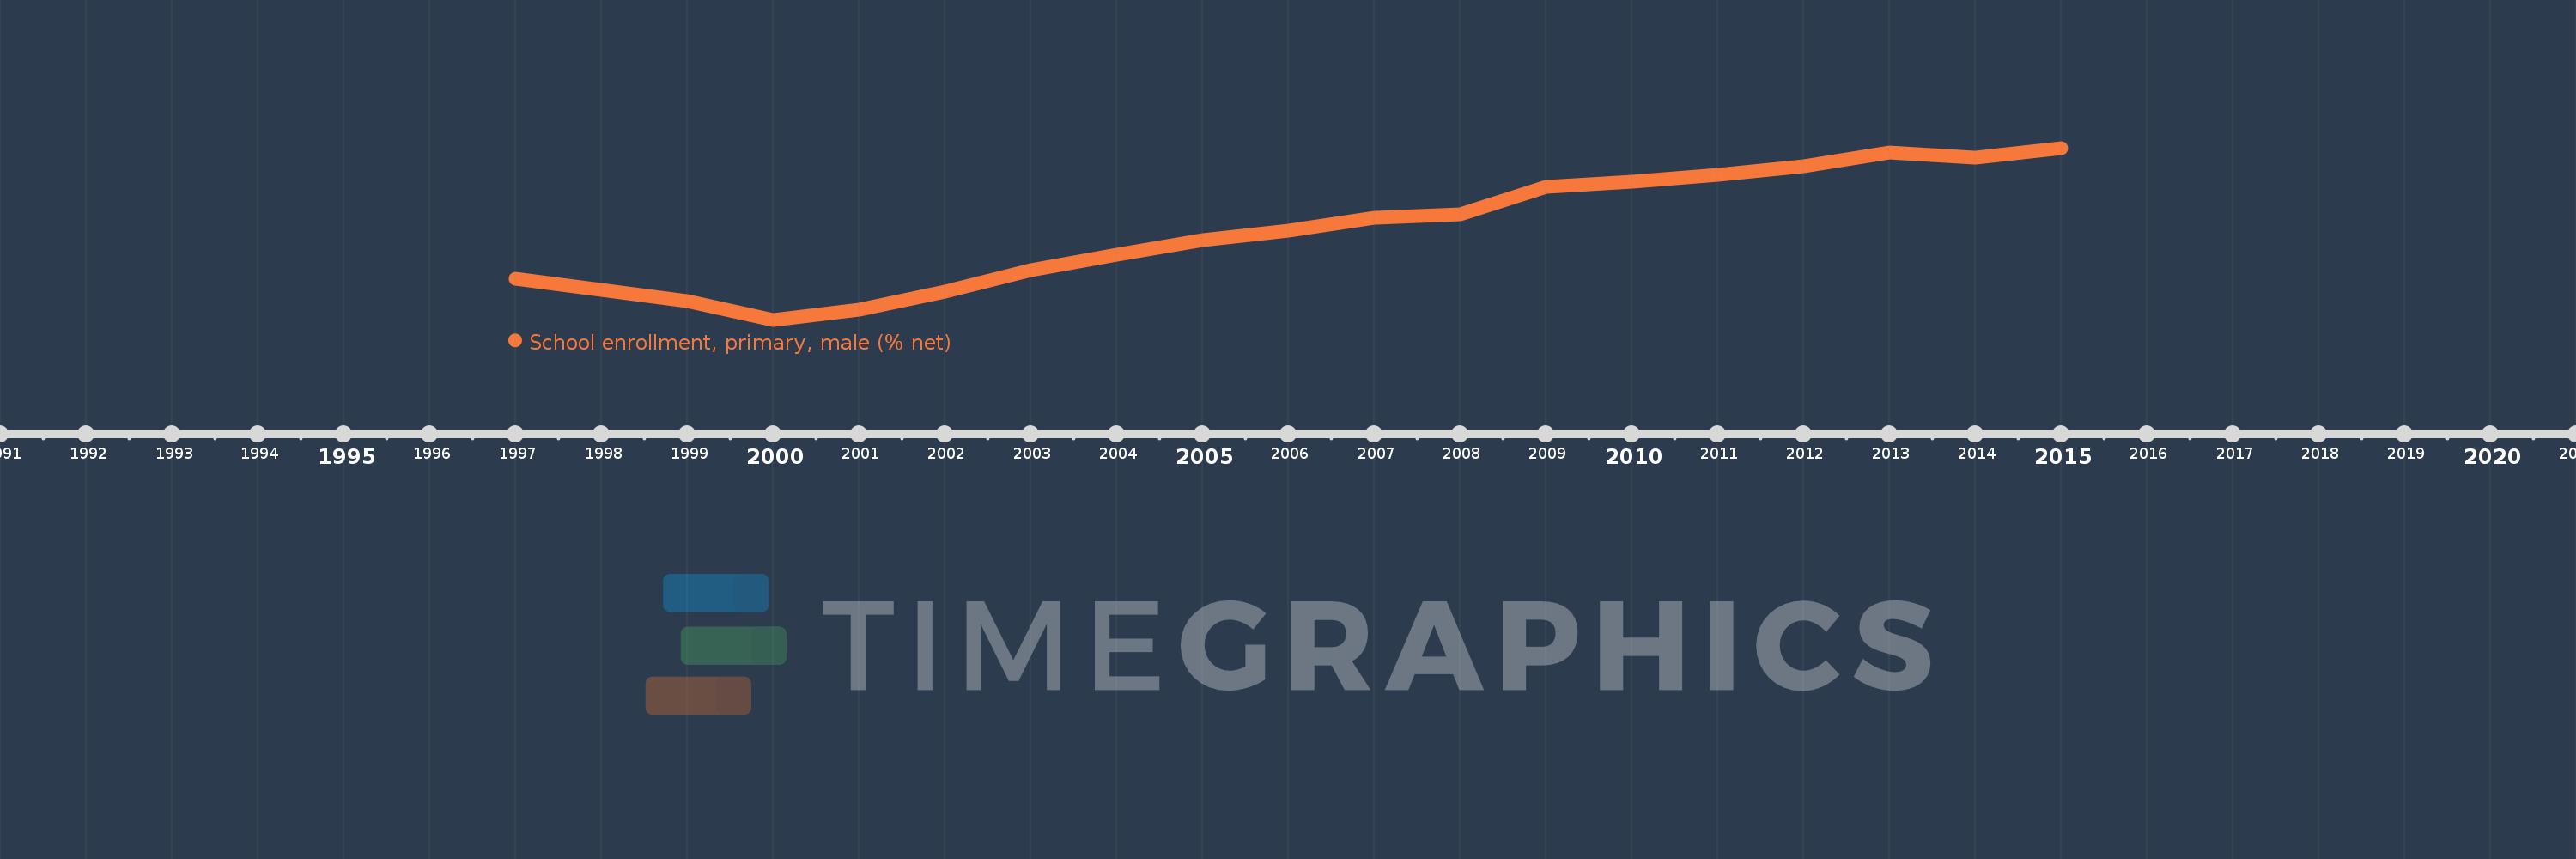
Questa scala temporale mostra un grafico dal 1997 anno al 2015 anno. Fragile and conflict affected situations. I dati fino ad 1996 anno non disponibili. Il numero di osservazioni attuali secondo i date: 18.
La fonte (nome):
Indicatori dello sviluppo mondiale
La fonte (organizzazione):
United Nations Educational, Scientific, and Cultural Organization (UNESCO) Institute for Statistics.
Categorie:
Education, Gender
sono stati aggiornati
23 apr 2017 anni
Indicatori delle variazioni dei valori per anni
In media:
71.499
Minima:
62.504
1 gen 2000 anni
Massimo:
79.252
1 gen 2015 anni
Alla data di osservazione
Valore
Variazione assoluta
La variazione rispetto al valore precedente
1 gen 1997 anni
66.467
+66.467
0.0%
1 gen 1999 anni
64.363
-2.103
-3.16%
1 gen 2000 anni
62.504
-1.86
-2.89%
1 gen 2001 anni
63.497
+0.994
1.59%
1 gen 2002 anni
65.268
+1.771
2.79%
1 gen 2003 anni
67.364
+2.097
3.21%
1 gen 2004 anni
68.829
+1.465
2.17%
1 gen 2005 anni
70.303
+1.474
2.14%
1 gen 2006 anni
71.204
+0.901
1.28%
1 gen 2007 anni
72.443
+1.239
1.74%
1 gen 2008 anni
72.781
+0.338
0.47%
1 gen 2009 anni
75.484
+2.703
3.71%
1 gen 2010 anni
75.954
+0.47
0.62%
1 gen 2011 anni
76.629
+0.675
0.89%
1 gen 2012 anni
77.483
+0.854
1.11%
1 gen 2013 anni
78.818
+1.335
1.72%
1 gen 2014 anni
78.341
-0.477
-0.6%
1 gen 2015 anni
79.252
+0.911
1.16%
Classificazione dei paesi secondo i statistiche attuali per anni