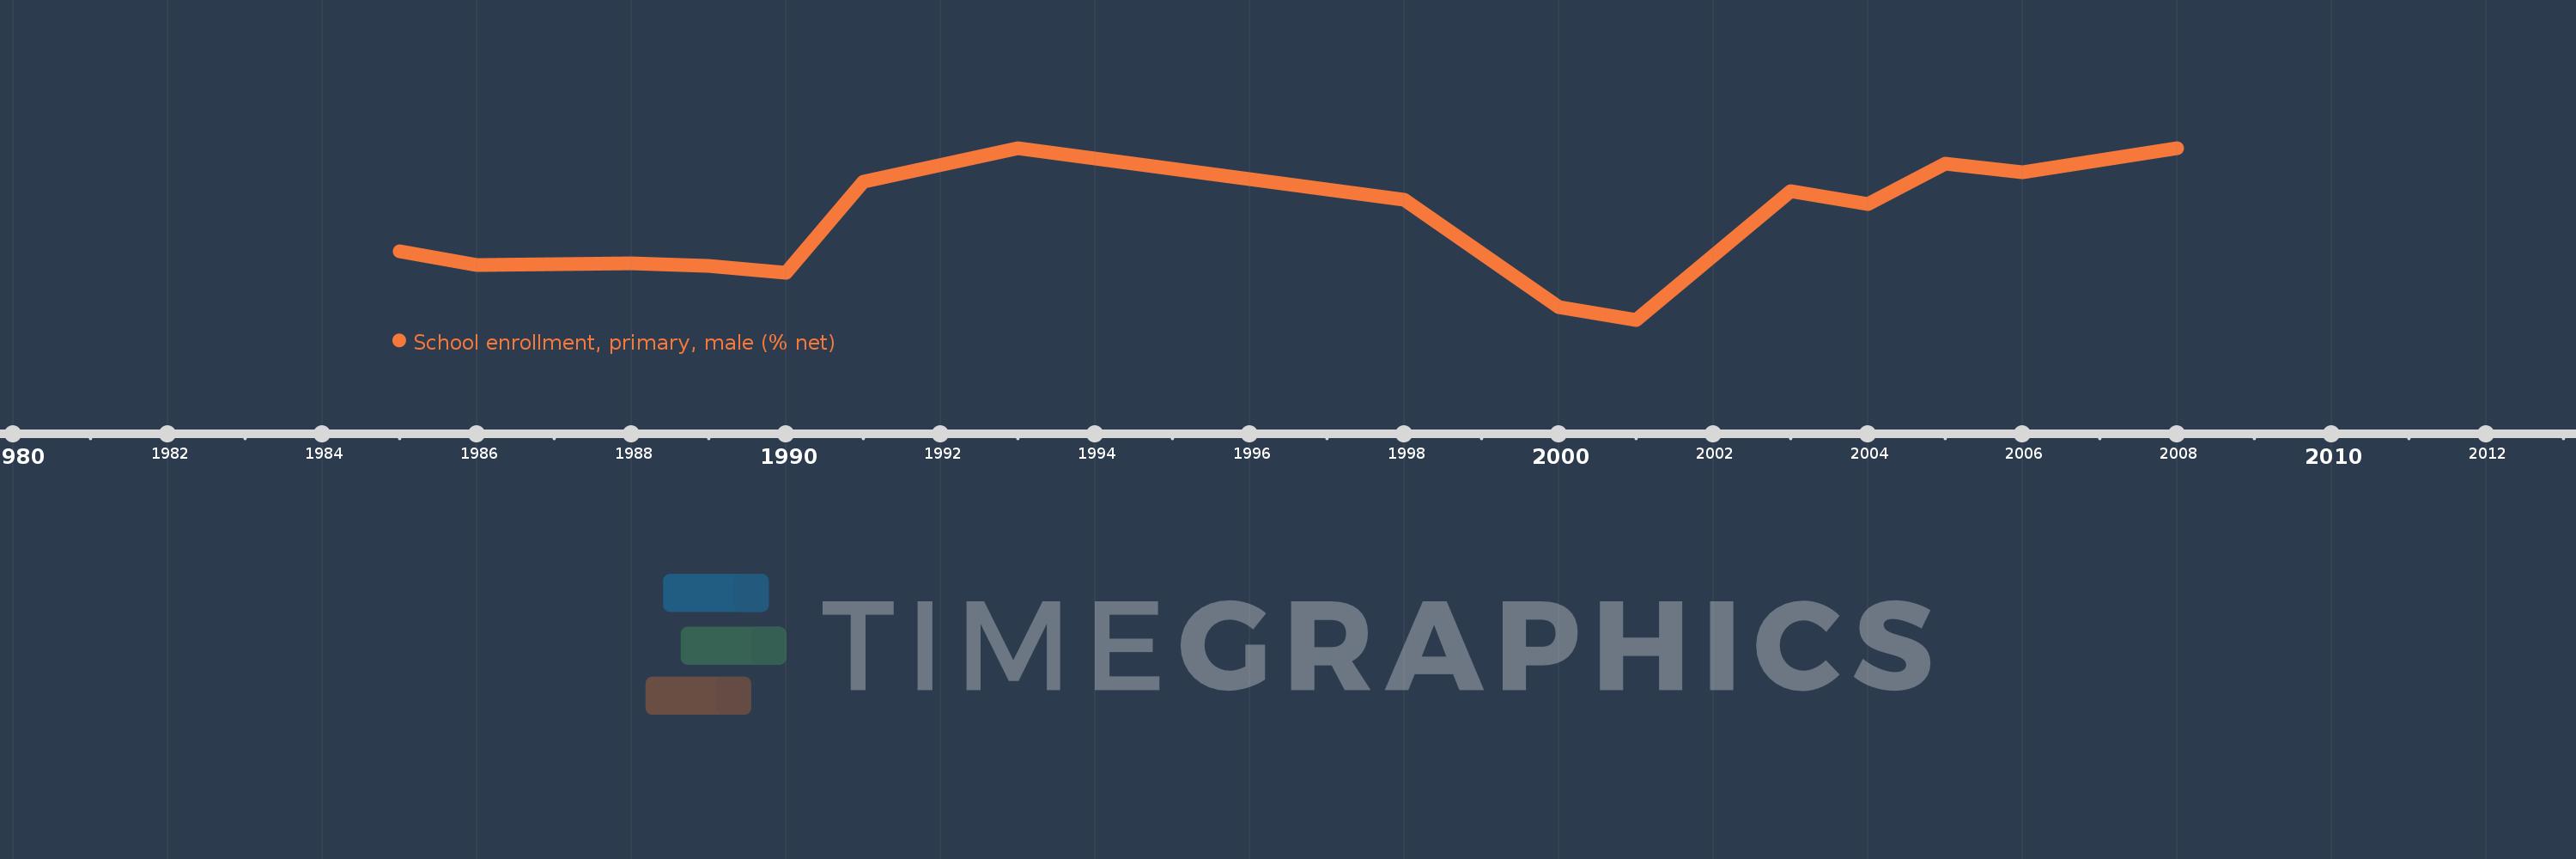
Questa scala temporale mostra un grafico dal 1985 anno al 2008 anno. Iran, Islamic Rep.. I dati fino ad 1984 anno non disponibili. Il numero di osservazioni attuali secondo i date: 16.
La fonte (nome):
Indicatori dello sviluppo mondiale
La fonte (organizzazione):
United Nations Educational, Scientific, and Cultural Organization (UNESCO) Institute for Statistics.
Categorie:
Education, Gender
sono stati aggiornati
23 apr 2017 anni
Indicatori delle variazioni dei valori per anni
In media:
93.477
Minima:
86.72
1 gen 2001 anni
Massimo:
99.13
1 gen 1993 anni
Alla data di osservazione
Valore
Variazione assoluta
La variazione rispetto al valore precedente
1 gen 1985 anni
91.644
+91.644
0.0%
1 gen 1986 anni
90.661
-0.983
-1.07%
1 gen 1987 anni
90.721
+0.06
0.07%
1 gen 1988 anni
90.785
+0.063
0.07%
1 gen 1989 anni
90.611
-0.174
-0.19%
1 gen 1990 anni
90.105
-0.506
-0.56%
1 gen 1991 anni
96.709
+6.604
7.33%
1 gen 1993 anni
99.13
+2.421
2.5%
1 gen 1998 anni
95.415
-3.715
-3.75%
1 gen 2000 anni
87.637
-7.777
-8.15%
1 gen 2001 anni
86.72
-0.917
-1.05%
1 gen 2003 anni
96.009
+9.289
10.71%
1 gen 2004 anni
95.048
-0.962
-1.0%
1 gen 2005 anni
97.97
+2.923
3.08%
1 gen 2006 anni
97.347
-0.623
-0.64%
1 gen 2008 anni
99.119
+1.772
1.82%
Classificazione dei paesi secondo i statistiche attuali per anni