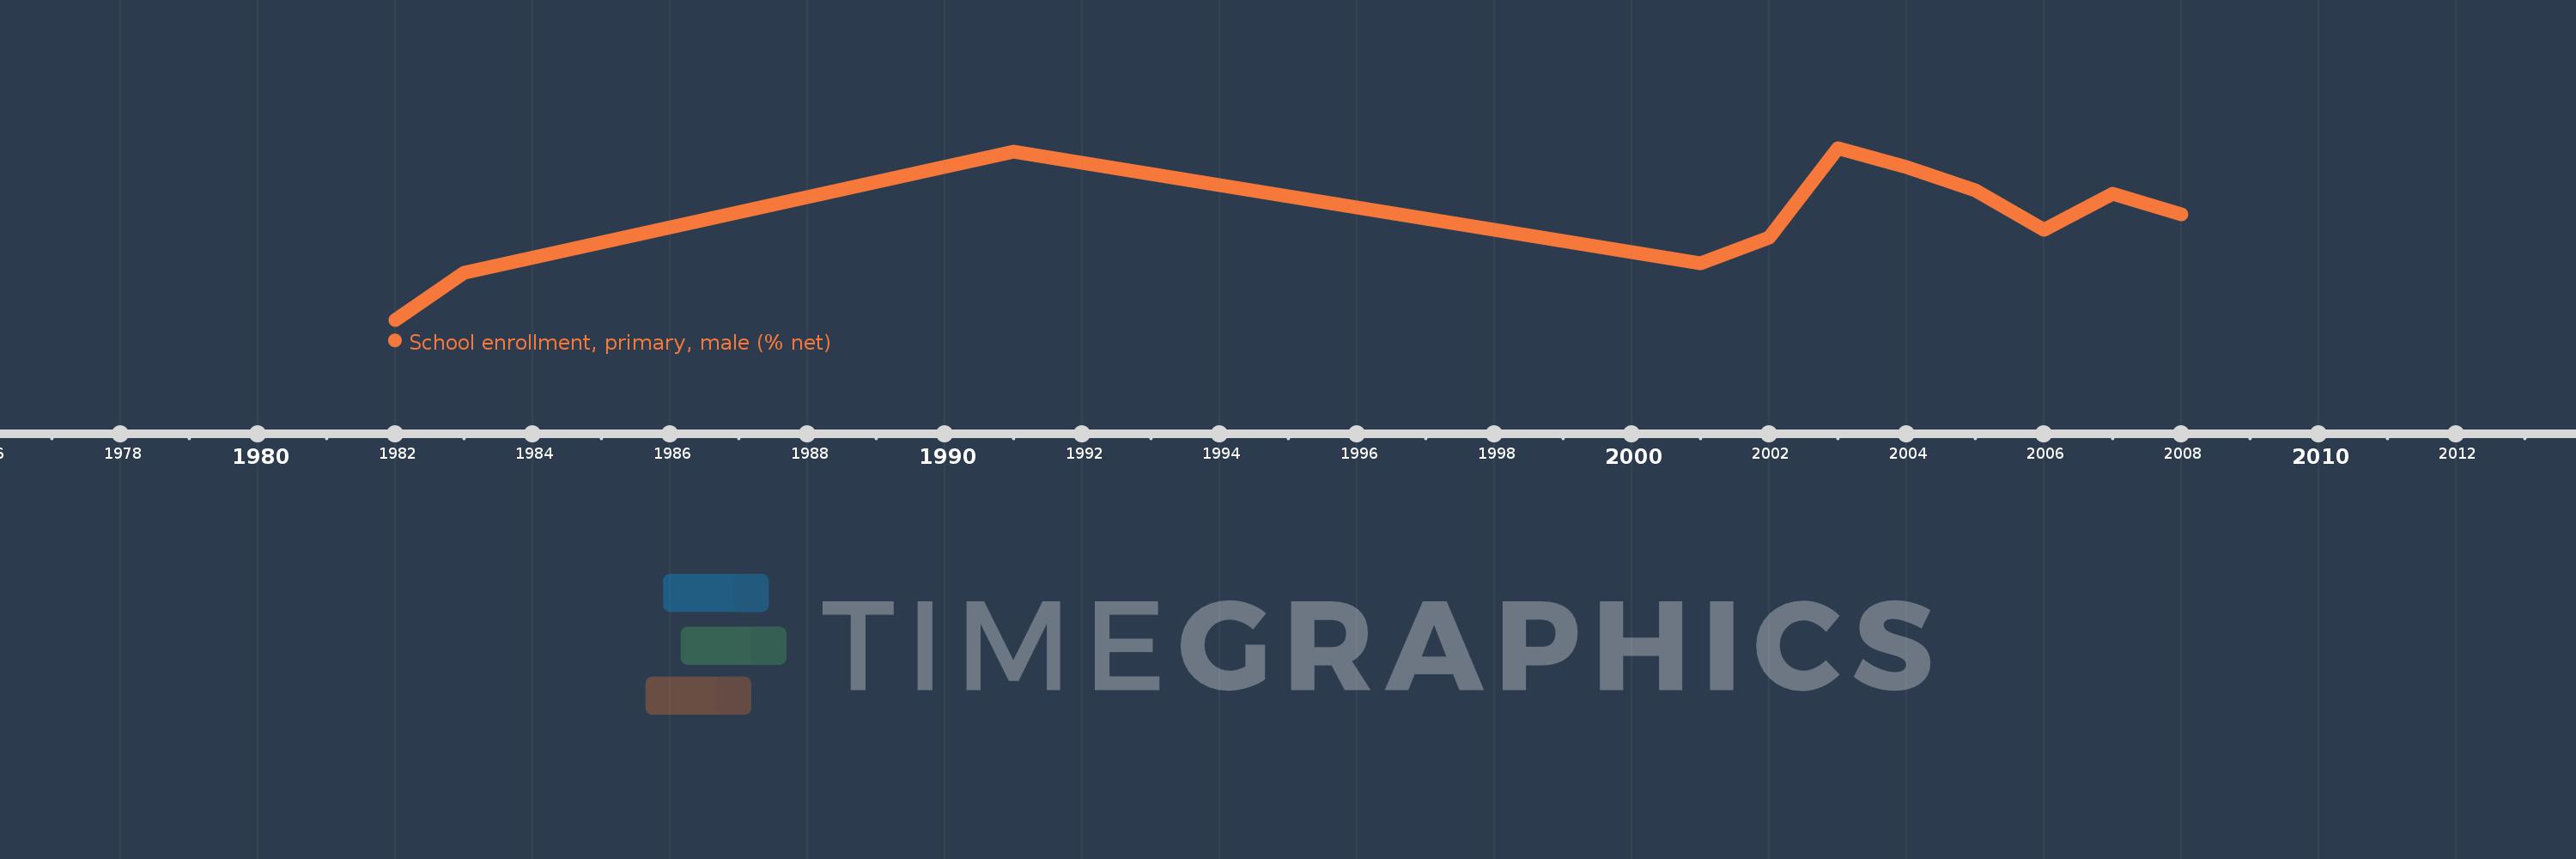
Questa scala temporale mostra un grafico dal 1982 anno al 2008 anno. St. Lucia. I dati fino ad 1981 anno non disponibili. Il numero di osservazioni attuali secondo i date: 11.
La fonte (nome):
Indicatori dello sviluppo mondiale
La fonte (organizzazione):
United Nations Educational, Scientific, and Cultural Organization (UNESCO) Institute for Statistics.
Categorie:
Education, Gender
sono stati aggiornati
23 apr 2017 anni
Indicatori delle variazioni dei valori per anni
In media:
94.372
Minima:
87.634
1 gen 1982 anni
Massimo:
98.904
1 gen 2003 anni
Alla data di osservazione
Valore
Variazione assoluta
La variazione rispetto al valore precedente
1 gen 1982 anni
87.634
+87.634
0.0%
1 gen 1983 anni
90.724
+3.09
3.53%
1 gen 1991 anni
98.681
+7.957
8.77%
1 gen 2001 anni
91.352
-7.329
-7.43%
1 gen 2002 anni
93.009
+1.656
1.81%
1 gen 2003 anni
98.904
+5.895
6.34%
1 gen 2004 anni
97.628
-1.276
-1.29%
1 gen 2005 anni
96.154
-1.474
-1.51%
1 gen 2006 anni
93.562
-2.592
-2.7%
1 gen 2007 anni
95.921
+2.359
2.52%
1 gen 2008 anni
94.525
-1.396
-1.46%
Classificazione dei paesi secondo i statistiche attuali per anni