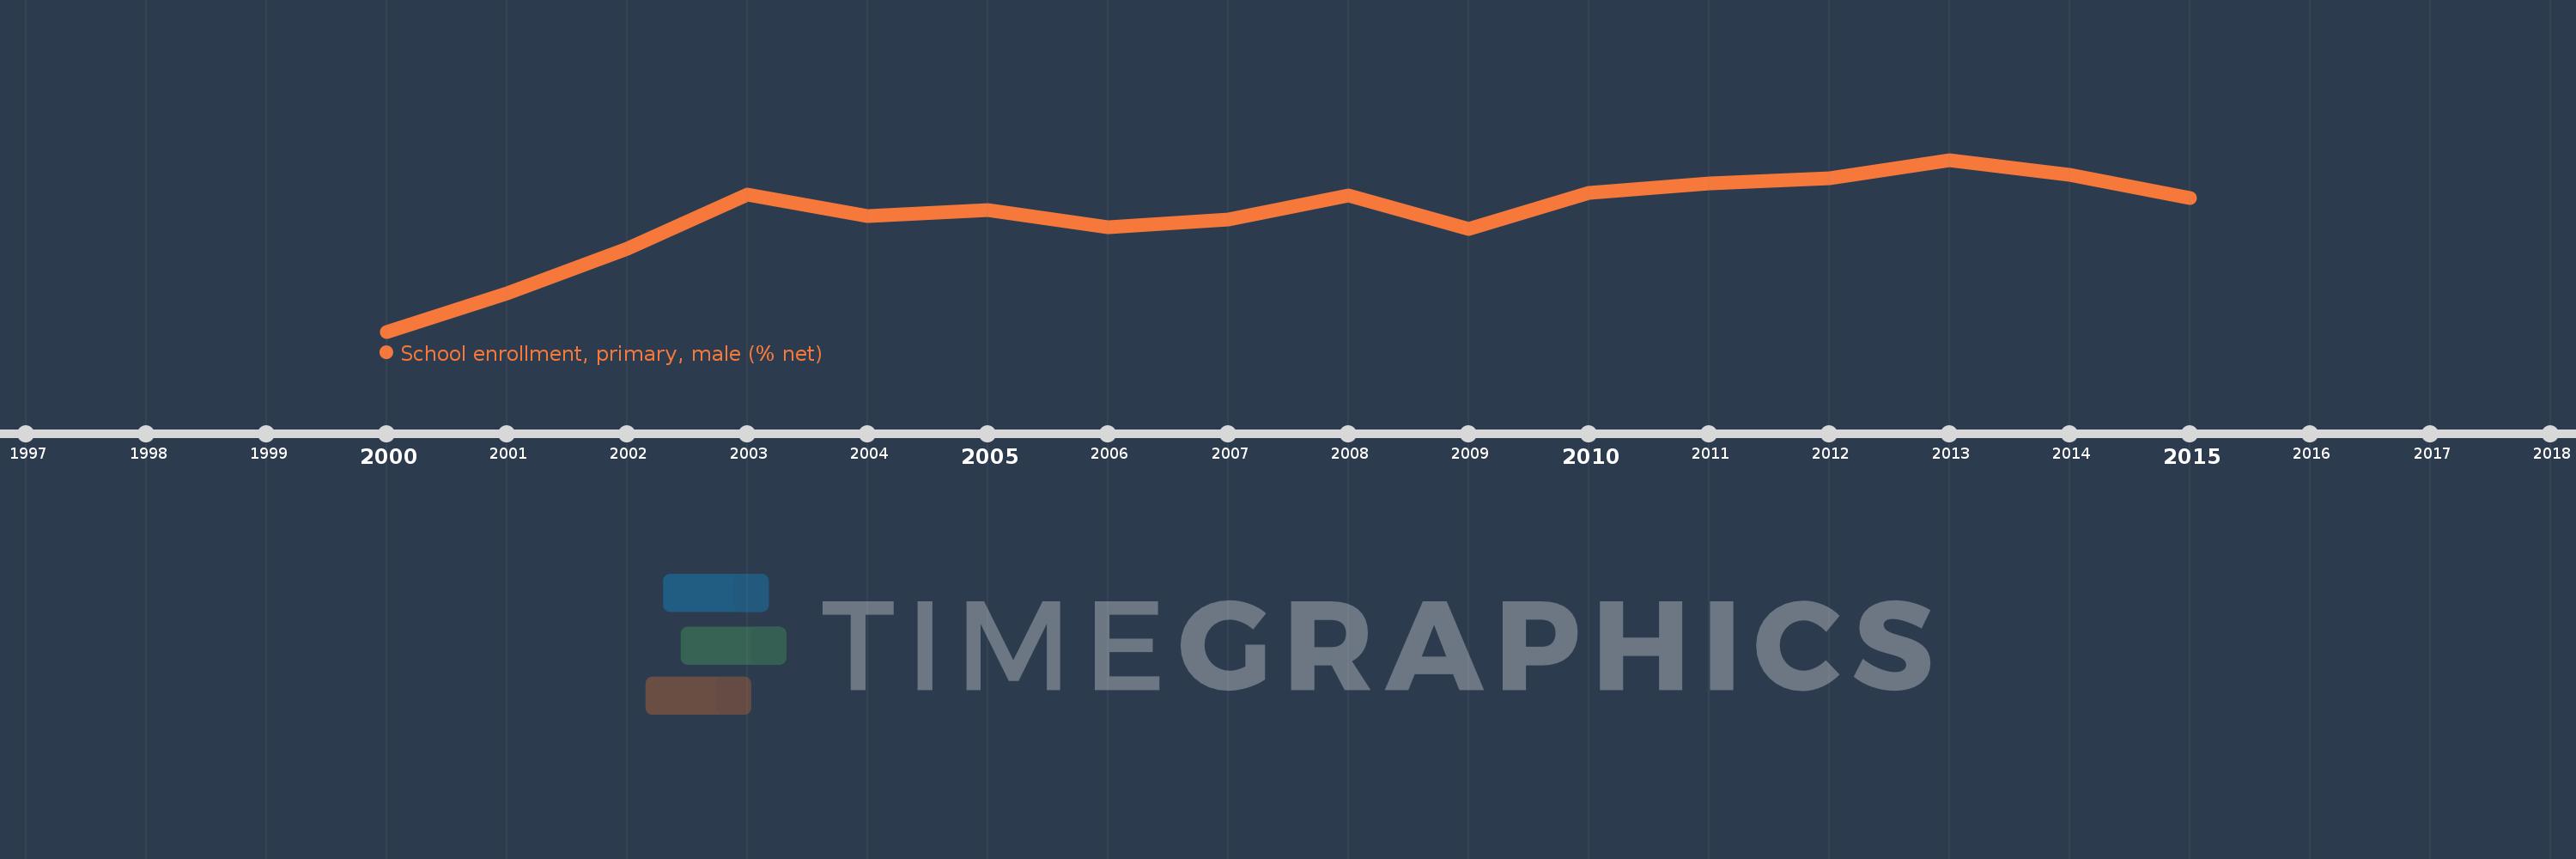
Questa scala temporale mostra un grafico dal 2000 anno al 2015 anno. Venezuela, RB. I dati fino ad 1999 anno non disponibili. Il numero di osservazioni attuali secondo i date: 16.
La fonte (nome):
Indicatori dello sviluppo mondiale
La fonte (organizzazione):
United Nations Educational, Scientific, and Cultural Organization (UNESCO) Institute for Statistics.
Categorie:
Education, Gender
sono stati aggiornati
23 apr 2017 anni
Indicatori delle variazioni dei valori per anni
In media:
89.709
Minima:
83.13
1 gen 2000 anni
Massimo:
92.887
1 gen 2013 anni
Alla data di osservazione
Valore
Variazione assoluta
La variazione rispetto al valore precedente
1 gen 2000 anni
83.13
+83.13
0.0%
1 gen 2001 anni
85.306
+2.176
2.62%
1 gen 2002 anni
87.845
+2.54
2.98%
1 gen 2003 anni
90.933
+3.088
3.52%
1 gen 2004 anni
89.688
-1.245
-1.37%
1 gen 2005 anni
90.011
+0.323
0.36%
1 gen 2006 anni
89.043
-0.968
-1.08%
1 gen 2007 anni
89.501
+0.458
0.51%
1 gen 2008 anni
90.863
+1.362
1.52%
1 gen 2009 anni
88.95
-1.913
-2.11%
1 gen 2010 anni
91.021
+2.07
2.33%
1 gen 2011 anni
91.556
+0.535
0.59%
1 gen 2012 anni
91.83
+0.274
0.3%
1 gen 2013 anni
92.887
+1.057
1.15%
1 gen 2014 anni
92.053
-0.834
-0.9%
1 gen 2015 anni
90.723
-1.331
-1.45%
Classificazione dei paesi secondo i statistiche attuali per anni