Questa scala temporale mostra un grafico dal 2007 anno al 2015 anno. Belgium. I dati fino ad 2006 anno non disponibili. Il numero di osservazioni attuali secondo i date: 8.
La fonte (nome):
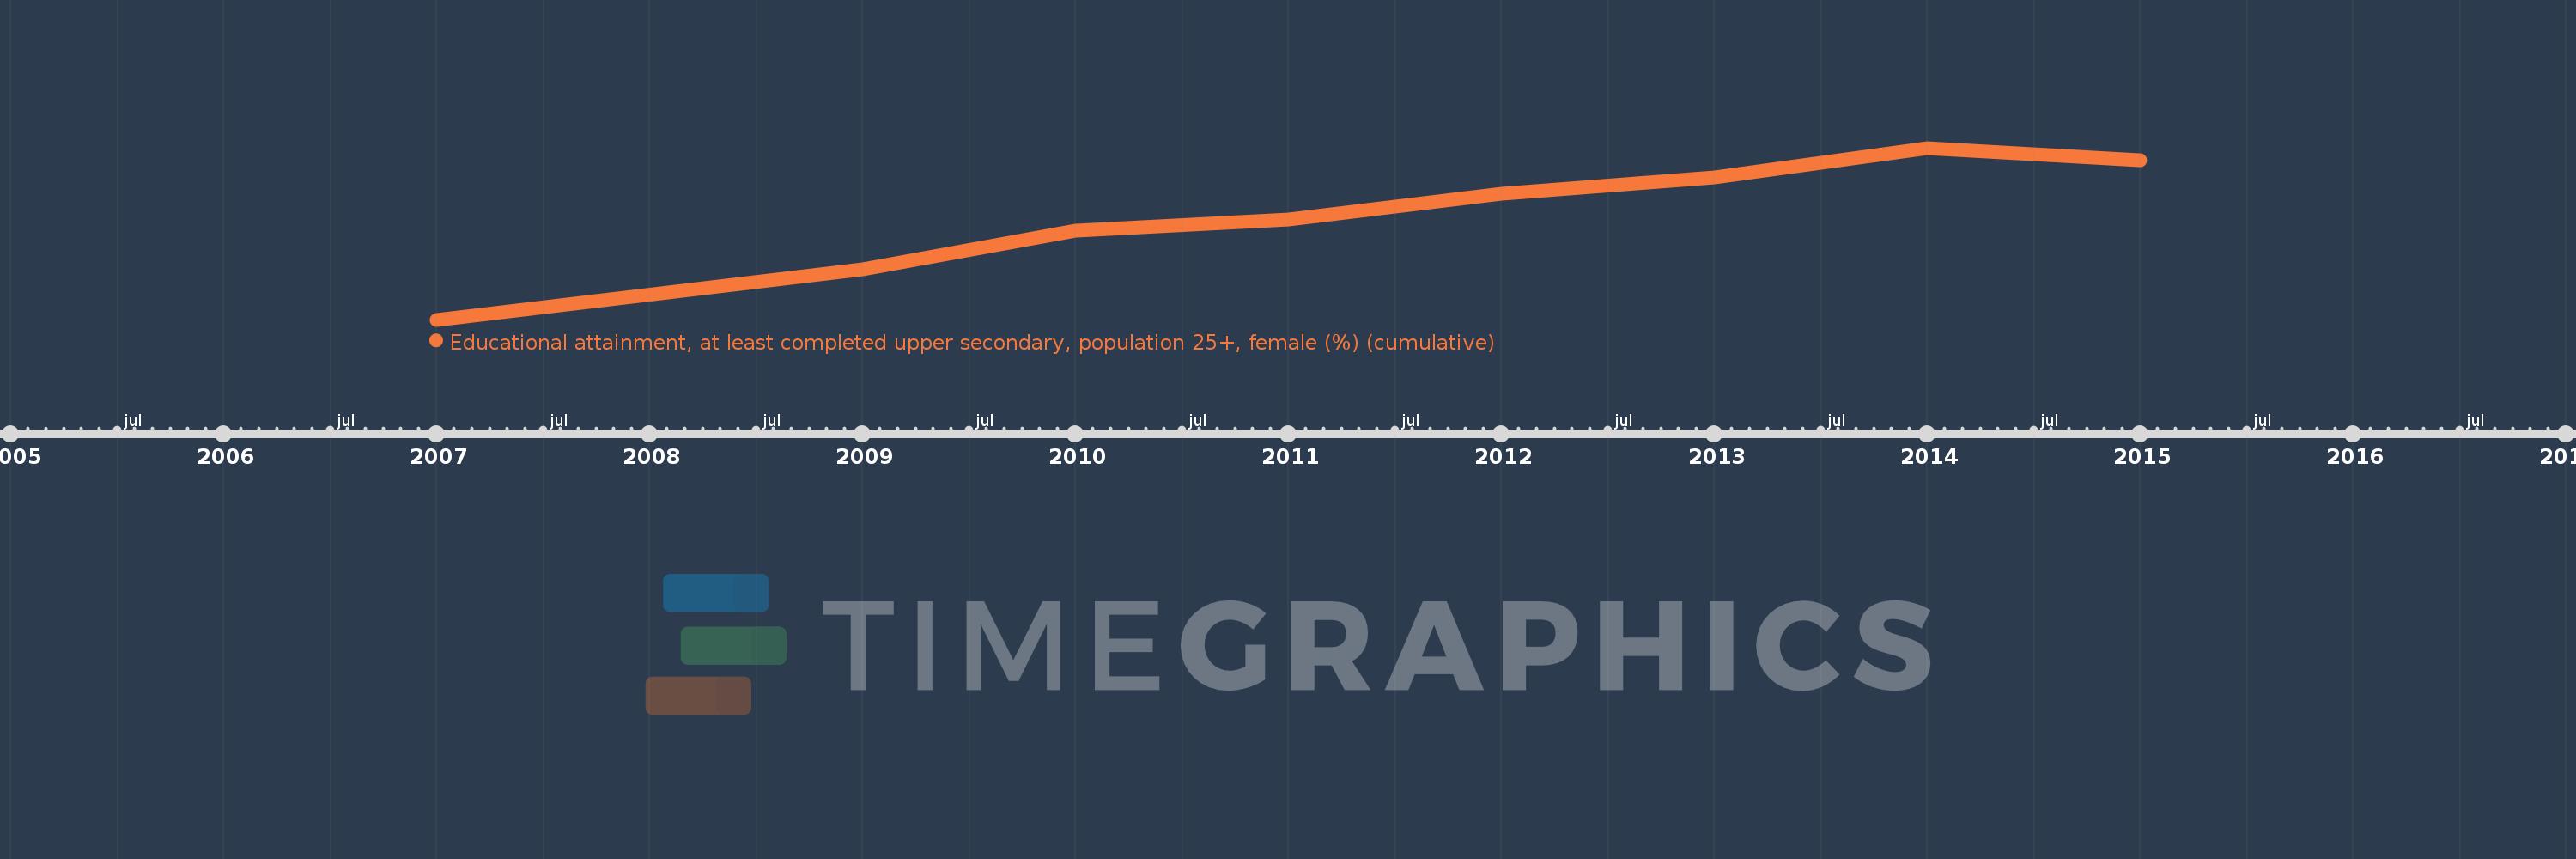
Indicatori dello sviluppo mondiale
La fonte (organizzazione):
United Nations Educational, Scientific, and Cultural Organization (UNESCO) Institute for Statistics.
Categorie:
Education, Gender
sono stati aggiornati
23 apr 2017 anni
Indicatori delle variazioni dei valori per anni
In media:
59.963
Minima:
55.467
1 gen 2007 anni
Massimo:
62.835
1 gen 2014 anni
Alla data di osservazione
Valore
Variazione assoluta
La variazione rispetto al valore precedente
1 gen 2007 anni
55.467
+55.467
0.0%
1 gen 2009 anni
57.633
+2.165
3.9%
1 gen 2010 anni
59.277
+1.645
2.85%
1 gen 2011 anni
59.753
+0.475
0.8%
1 gen 2012 anni
60.886
+1.133
1.9%
1 gen 2013 anni
61.557
+0.672
1.1%
1 gen 2014 anni
62.835
+1.277
2.07%
1 gen 2015 anni
62.297
-0.538
-0.86%
Classificazione dei paesi secondo i statistiche attuali per anni