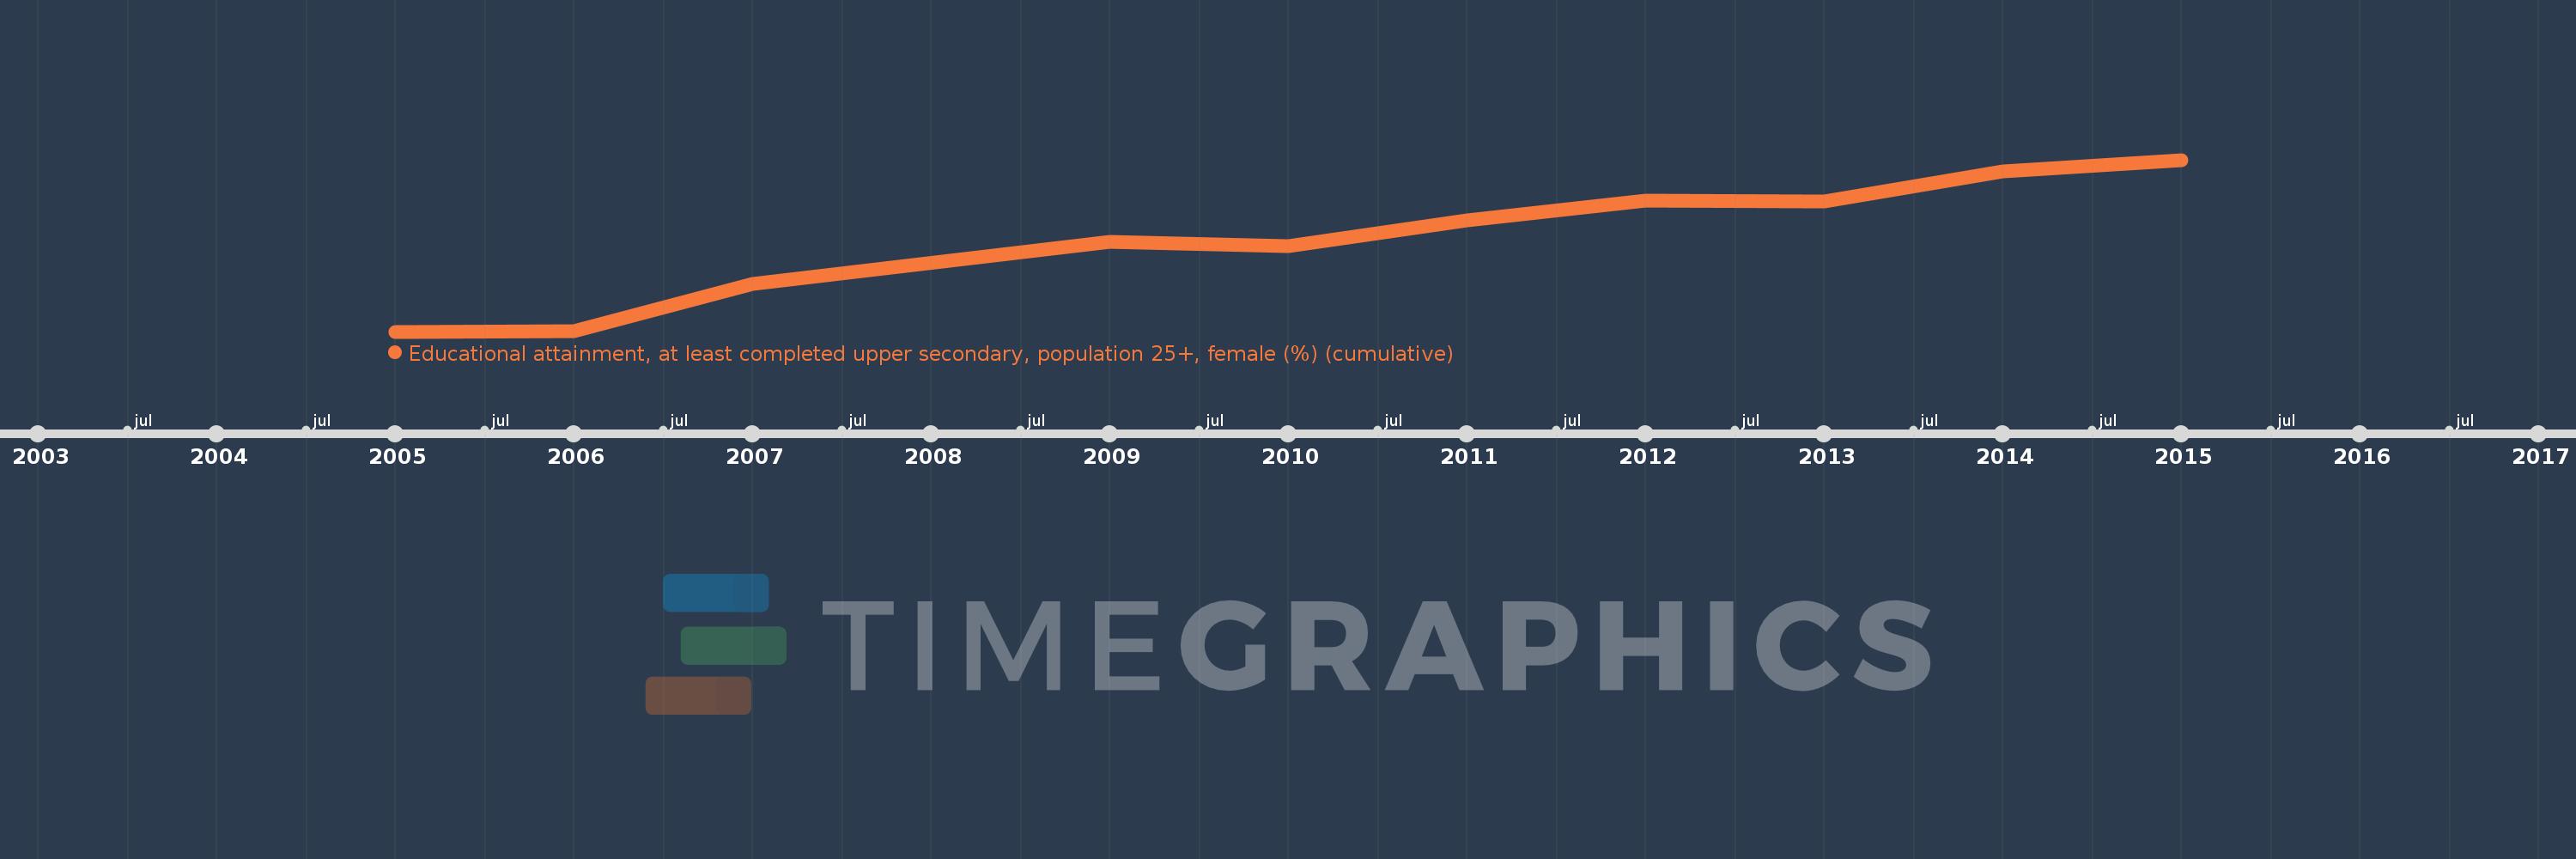
Questa scala temporale mostra un grafico dal 2005 anno al 2015 anno. United States. I dati fino ad 2004 anno non disponibili. Il numero di osservazioni attuali secondo i date: 10.
La fonte (nome):
Indicatori dello sviluppo mondiale
La fonte (organizzazione):
United Nations Educational, Scientific, and Cultural Organization (UNESCO) Institute for Statistics.
Categorie:
Education, Gender
sono stati aggiornati
23 apr 2017 anni
Indicatori delle variazioni dei valori per anni
In media:
87.284
Minima:
85.434
1 gen 2005 anni
Massimo:
88.859
1 gen 2015 anni
Alla data di osservazione
Valore
Variazione assoluta
La variazione rispetto al valore precedente
1 gen 2005 anni
85.434
+85.434
0.0%
1 gen 2006 anni
85.436
+0.003
0.0%
1 gen 2007 anni
86.381
+0.945
1.11%
1 gen 2009 anni
87.226
+0.845
0.98%
1 gen 2010 anni
87.133
-0.094
-0.11%
1 gen 2011 anni
87.66
+0.527
0.61%
1 gen 2012 anni
88.046
+0.386
0.44%
1 gen 2013 anni
88.037
-0.01
-0.01%
1 gen 2014 anni
88.624
+0.587
0.67%
1 gen 2015 anni
88.859
+0.235
0.26%
Classificazione dei paesi secondo i statistiche attuali per anni