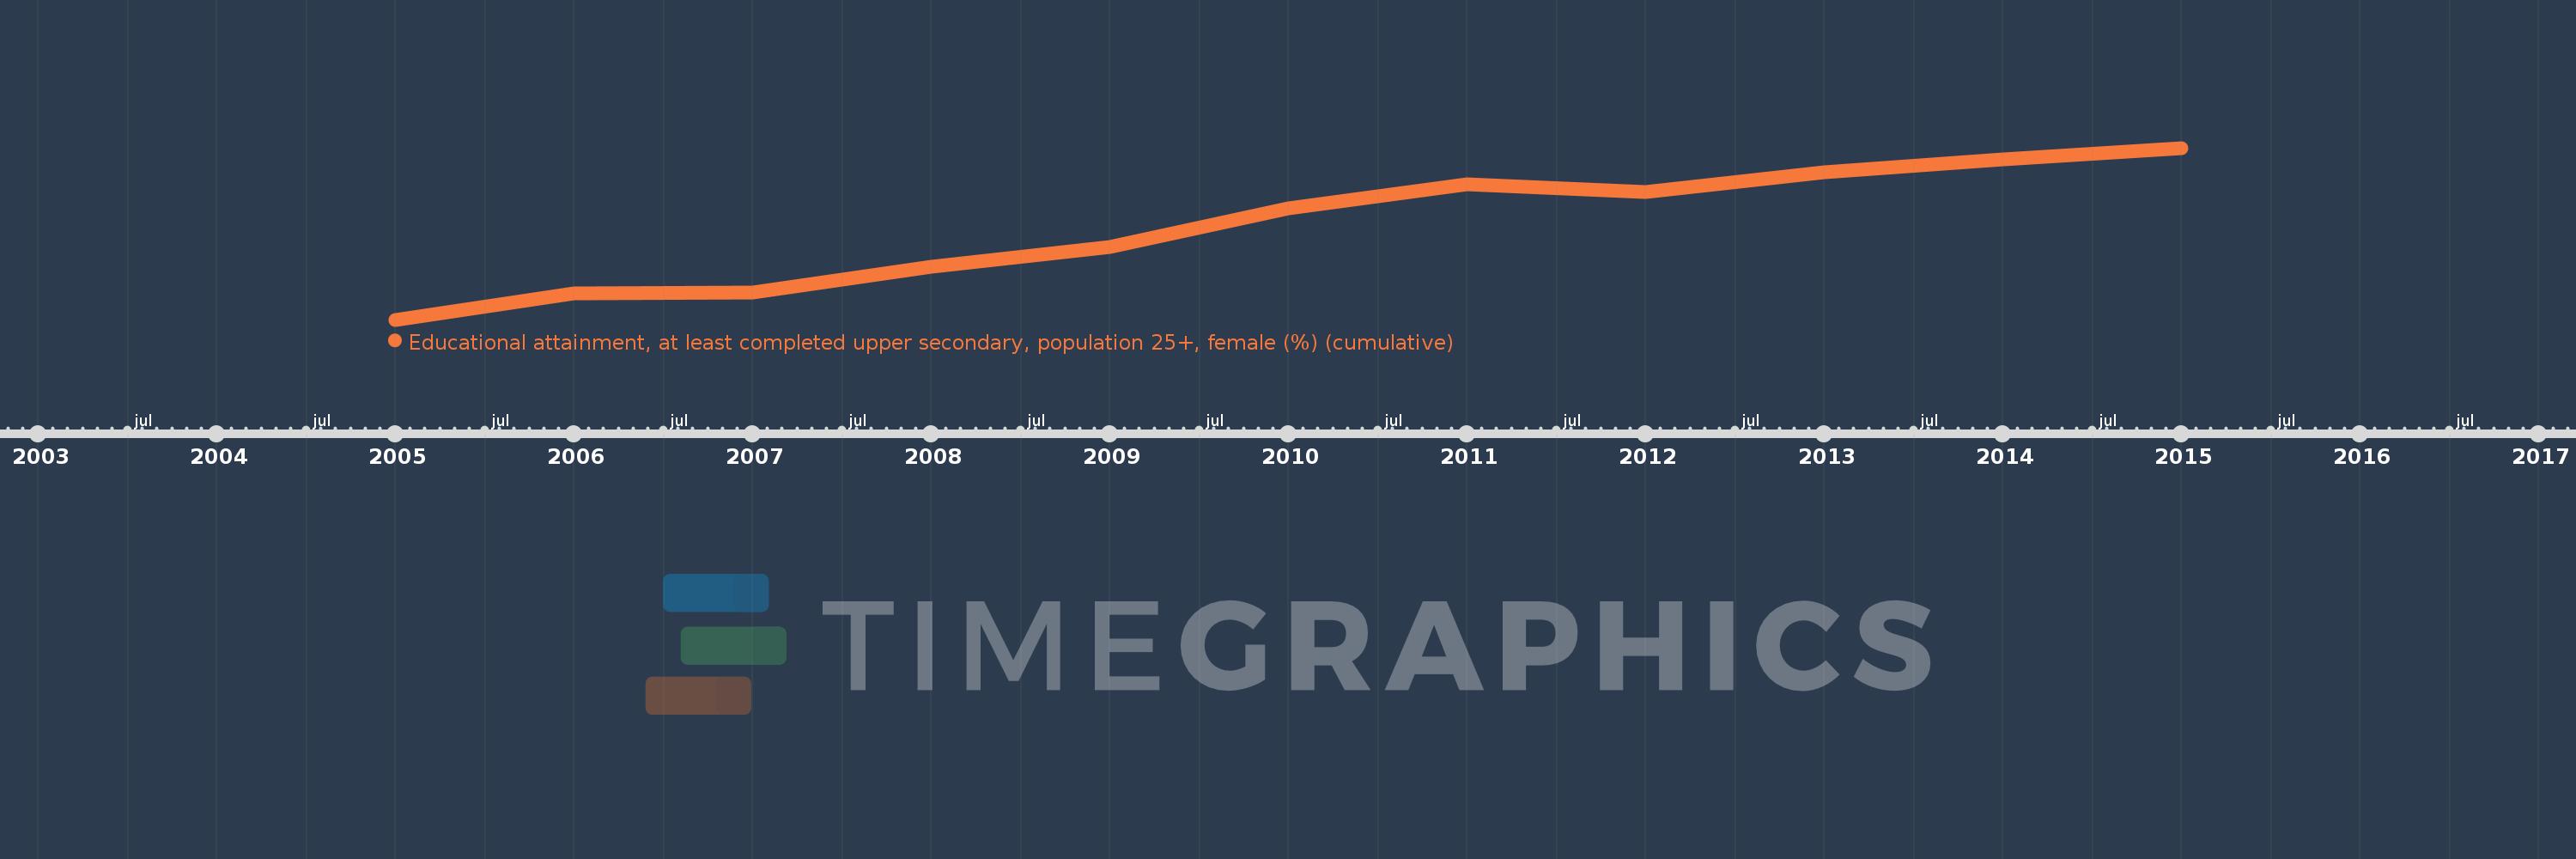
Questa scala temporale mostra un grafico dal 2005 anno al 2015 anno. Latvia. I dati fino ad 2004 anno non disponibili. Il numero di osservazioni attuali secondo i date: 11.
La fonte (nome):
Indicatori dello sviluppo mondiale
La fonte (organizzazione):
United Nations Educational, Scientific, and Cultural Organization (UNESCO) Institute for Statistics.
Categorie:
Education, Gender
sono stati aggiornati
23 apr 2017 anni
Indicatori delle variazioni dei valori per anni
In media:
85.476
Minima:
80.045
1 gen 2005 anni
Massimo:
89.975
1 gen 2015 anni
Alla data di osservazione
Valore
Variazione assoluta
La variazione rispetto al valore precedente
1 gen 2005 anni
80.045
+80.045
0.0%
1 gen 2006 anni
81.545
+1.499
1.87%
1 gen 2007 anni
81.629
+0.084
0.1%
1 gen 2008 anni
83.099
+1.47
1.8%
1 gen 2009 anni
84.273
+1.174
1.41%
1 gen 2010 anni
86.507
+2.234
2.65%
1 gen 2011 anni
87.866
+1.36
1.57%
1 gen 2012 anni
87.441
-0.425
-0.48%
1 gen 2013 anni
88.556
+1.115
1.28%
1 gen 2014 anni
89.296
+0.74
0.84%
1 gen 2015 anni
89.975
+0.679
0.76%
Classificazione dei paesi secondo i statistiche attuali per anni