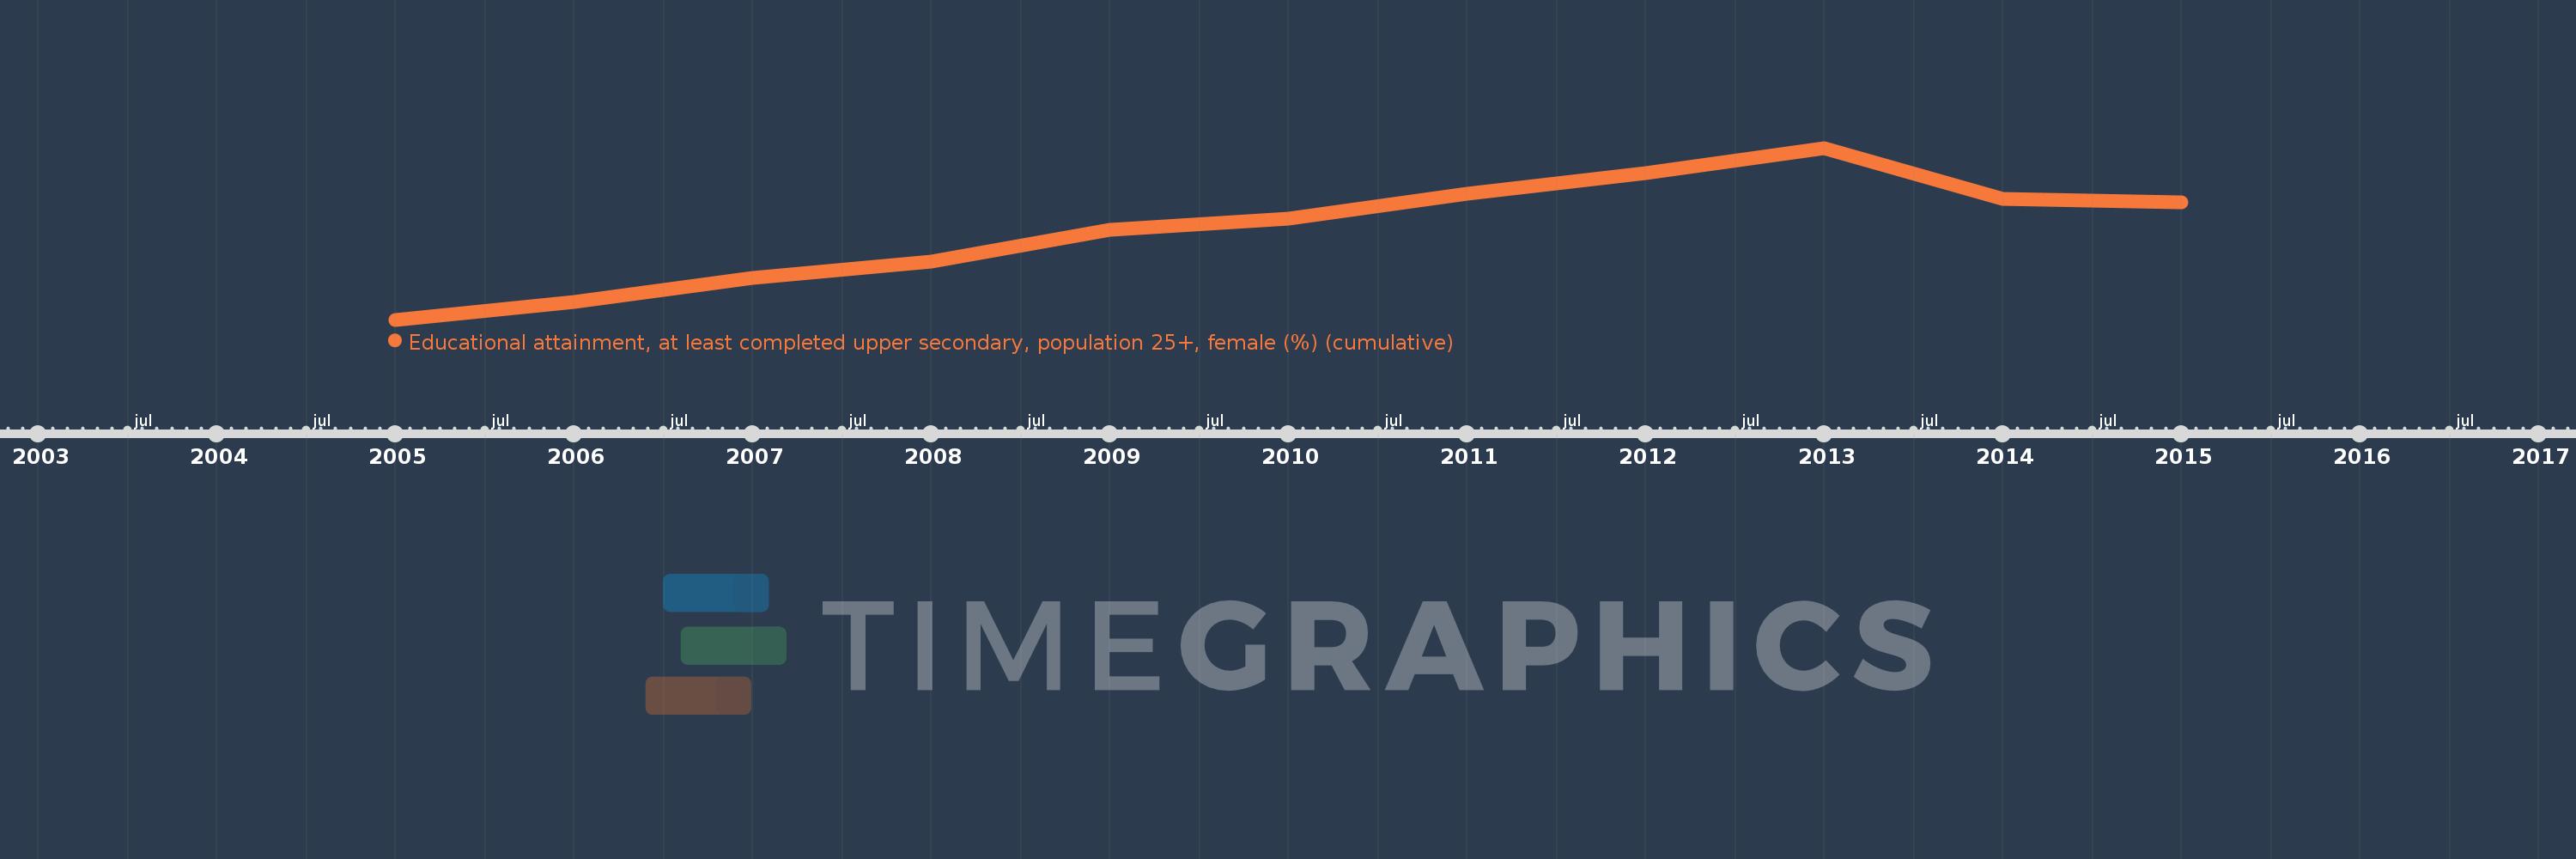
Questa scala temporale mostra un grafico dal 2005 anno al 2015 anno. Australia. I dati fino ad 2004 anno non disponibili. Il numero di osservazioni attuali secondo i date: 11.
La fonte (nome):
Indicatori dello sviluppo mondiale
La fonte (organizzazione):
United Nations Educational, Scientific, and Cultural Organization (UNESCO) Institute for Statistics.
Categorie:
Education, Gender
sono stati aggiornati
23 apr 2017 anni
Indicatori delle variazioni dei valori per anni
In media:
67.206
Minima:
58.628
1 gen 2005 anni
Massimo:
75.002
1 gen 2013 anni
Alla data di osservazione
Valore
Variazione assoluta
La variazione rispetto al valore precedente
1 gen 2005 anni
58.628
+58.628
0.0%
1 gen 2006 anni
60.288
+1.66
2.83%
1 gen 2007 anni
62.584
+2.296
3.81%
1 gen 2008 anni
64.178
+1.594
2.55%
1 gen 2009 anni
67.178
+2.999
4.67%
1 gen 2010 anni
68.233
+1.056
1.57%
1 gen 2011 anni
70.602
+2.369
3.47%
1 gen 2012 anni
72.638
+2.036
2.88%
1 gen 2013 anni
75.002
+2.364
3.25%
1 gen 2014 anni
70.12
-4.882
-6.51%
1 gen 2015 anni
69.812
-0.308
-0.44%
Classificazione dei paesi secondo i statistiche attuali per anni