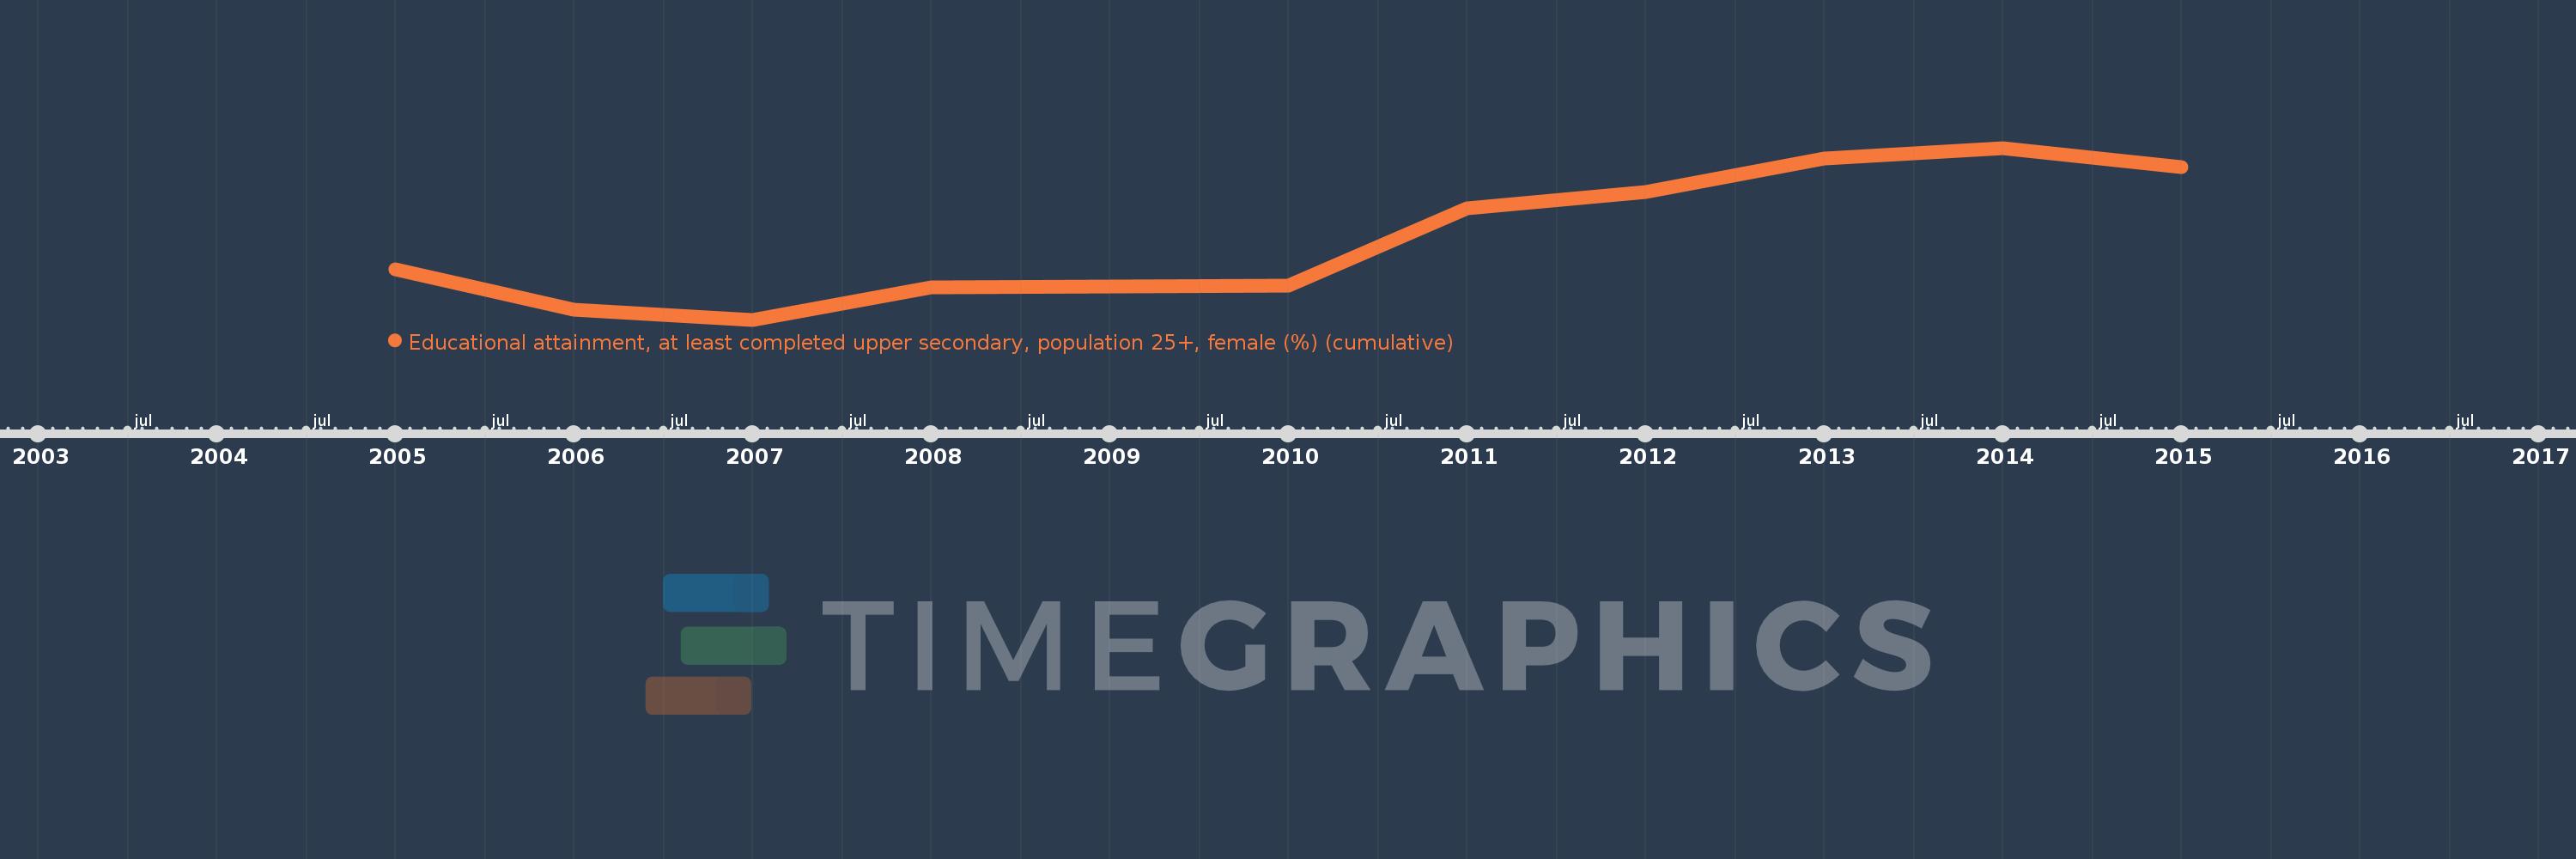
Questa scala temporale mostra un grafico dal 2005 anno al 2015 anno. Peru. I dati fino ad 2004 anno non disponibili. Il numero di osservazioni attuali secondo i date: 11.
La fonte (nome):
Indicatori dello sviluppo mondiale
La fonte (organizzazione):
United Nations Educational, Scientific, and Cultural Organization (UNESCO) Institute for Statistics.
Categorie:
Education, Gender
sono stati aggiornati
23 apr 2017 anni
Indicatori delle variazioni dei valori per anni
In media:
45.443
Minima:
39.714
1 gen 2007 anni
Massimo:
51.942
1 gen 2014 anni
Alla data di osservazione
Valore
Variazione assoluta
La variazione rispetto al valore precedente
1 gen 2005 anni
43.314
+43.314
0.0%
1 gen 2006 anni
40.403
-2.911
-6.72%
1 gen 2007 anni
39.714
-0.689
-1.71%
1 gen 2008 anni
42.028
+2.314
5.83%
1 gen 2009 anni
42.078
+0.05
0.12%
1 gen 2010 anni
42.128
+0.05
0.12%
1 gen 2011 anni
47.641
+5.513
13.09%
1 gen 2012 anni
48.834
+1.193
2.5%
1 gen 2013 anni
51.192
+2.358
4.83%
1 gen 2014 anni
51.942
+0.75
1.46%
1 gen 2015 anni
50.595
-1.346
-2.59%
Classificazione dei paesi secondo i statistiche attuali per anni