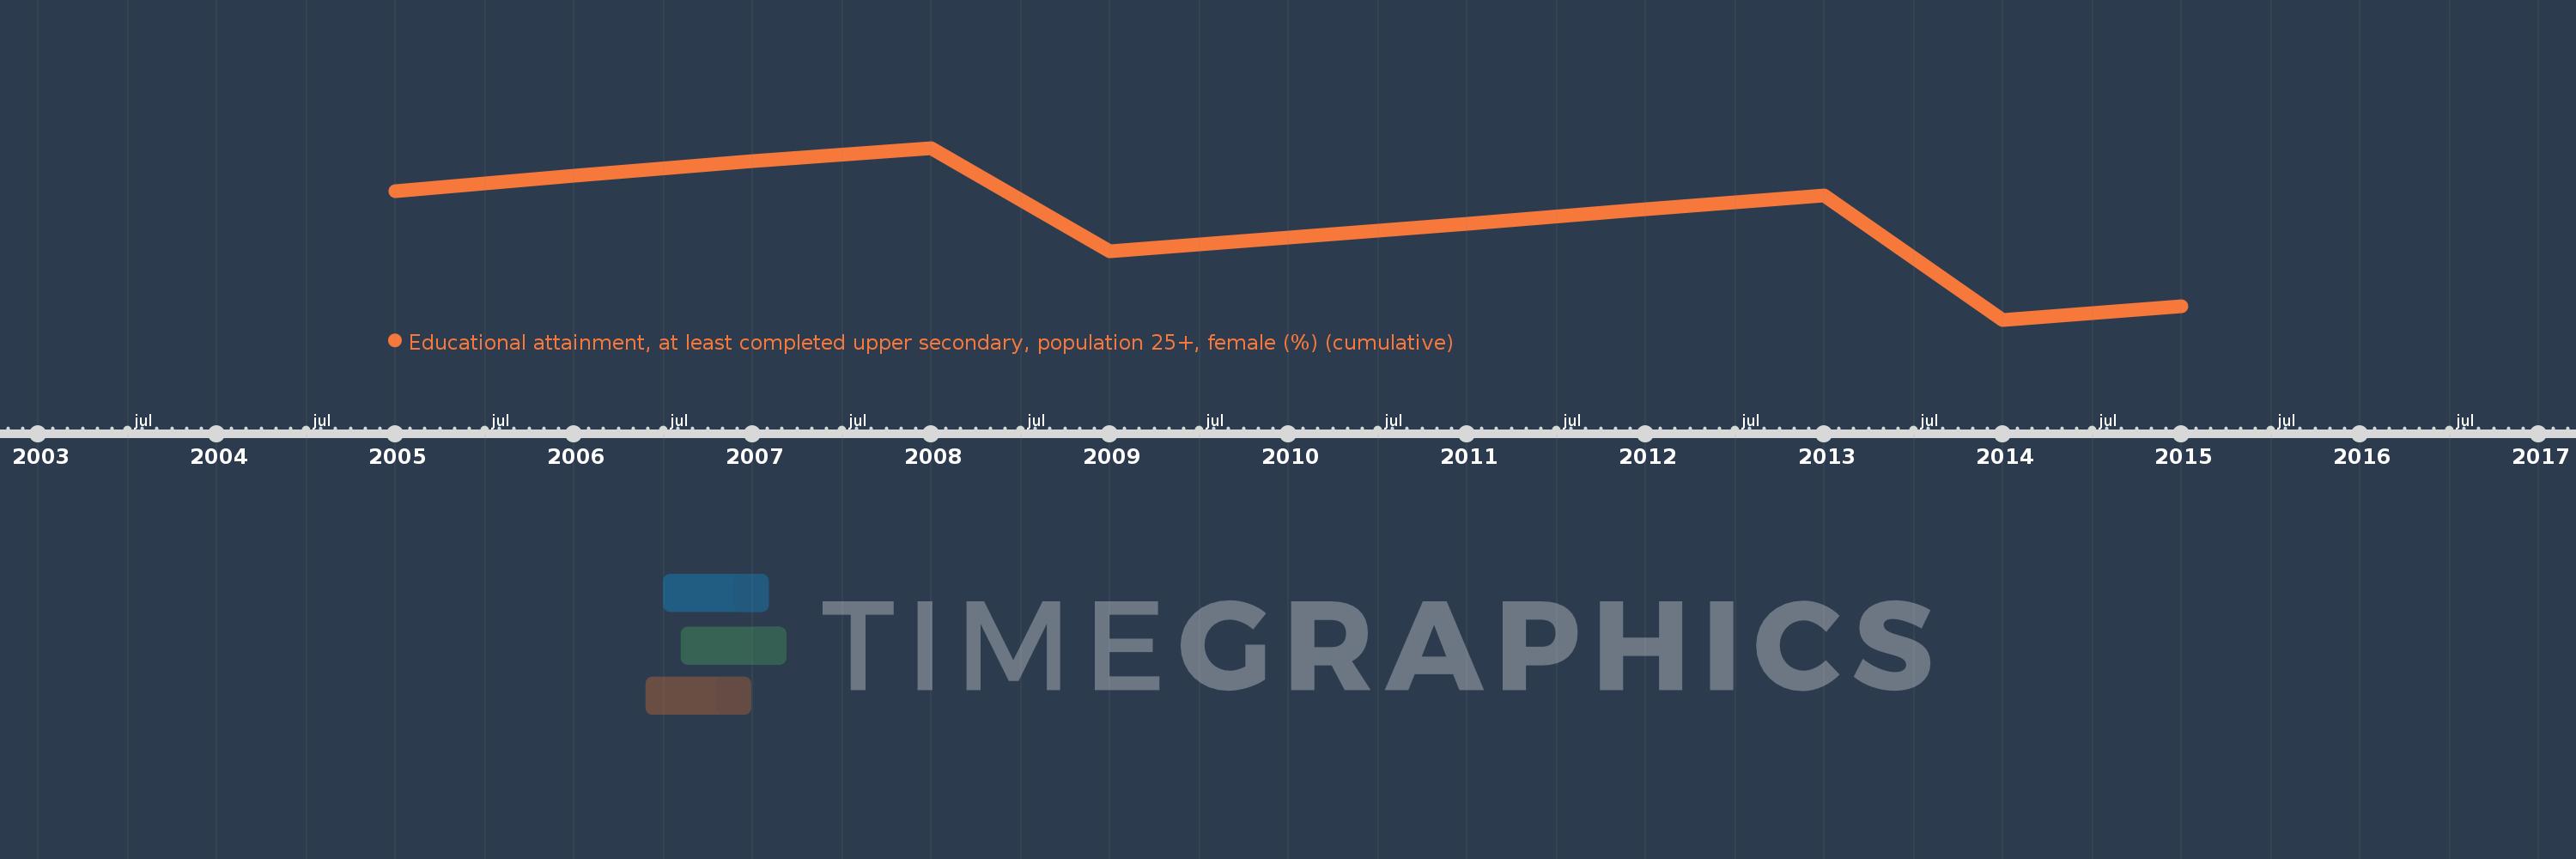
Questa scala temporale mostra un grafico dal 2005 anno al 2015 anno. Sweden. I dati fino ad 2004 anno non disponibili. Il numero di osservazioni attuali secondo i date: 11.
La fonte (nome):
Indicatori dello sviluppo mondiale
La fonte (organizzazione):
United Nations Educational, Scientific, and Cultural Organization (UNESCO) Institute for Statistics.
Categorie:
Education, Gender
sono stati aggiornati
23 apr 2017 anni
Indicatori delle variazioni dei valori per anni
In media:
78.295
Minima:
72.845
1 gen 2014 anni
Massimo:
82.217
1 gen 2008 anni
Alla data di osservazione
Valore
Variazione assoluta
La variazione rispetto al valore precedente
1 gen 2005 anni
79.859
+79.859
0.0%
1 gen 2006 anni
80.723
+0.864
1.08%
1 gen 2007 anni
81.506
+0.783
0.97%
1 gen 2008 anni
82.217
+0.711
0.87%
1 gen 2009 anni
76.576
-5.641
-6.86%
1 gen 2010 anni
77.347
+0.771
1.01%
1 gen 2011 anni
78.088
+0.741
0.96%
1 gen 2012 anni
78.865
+0.777
0.99%
1 gen 2013 anni
79.644
+0.78
0.99%
1 gen 2014 anni
72.845
-6.8
-8.54%
1 gen 2015 anni
73.578
+0.733
1.01%
Classificazione dei paesi secondo i statistiche attuali per anni