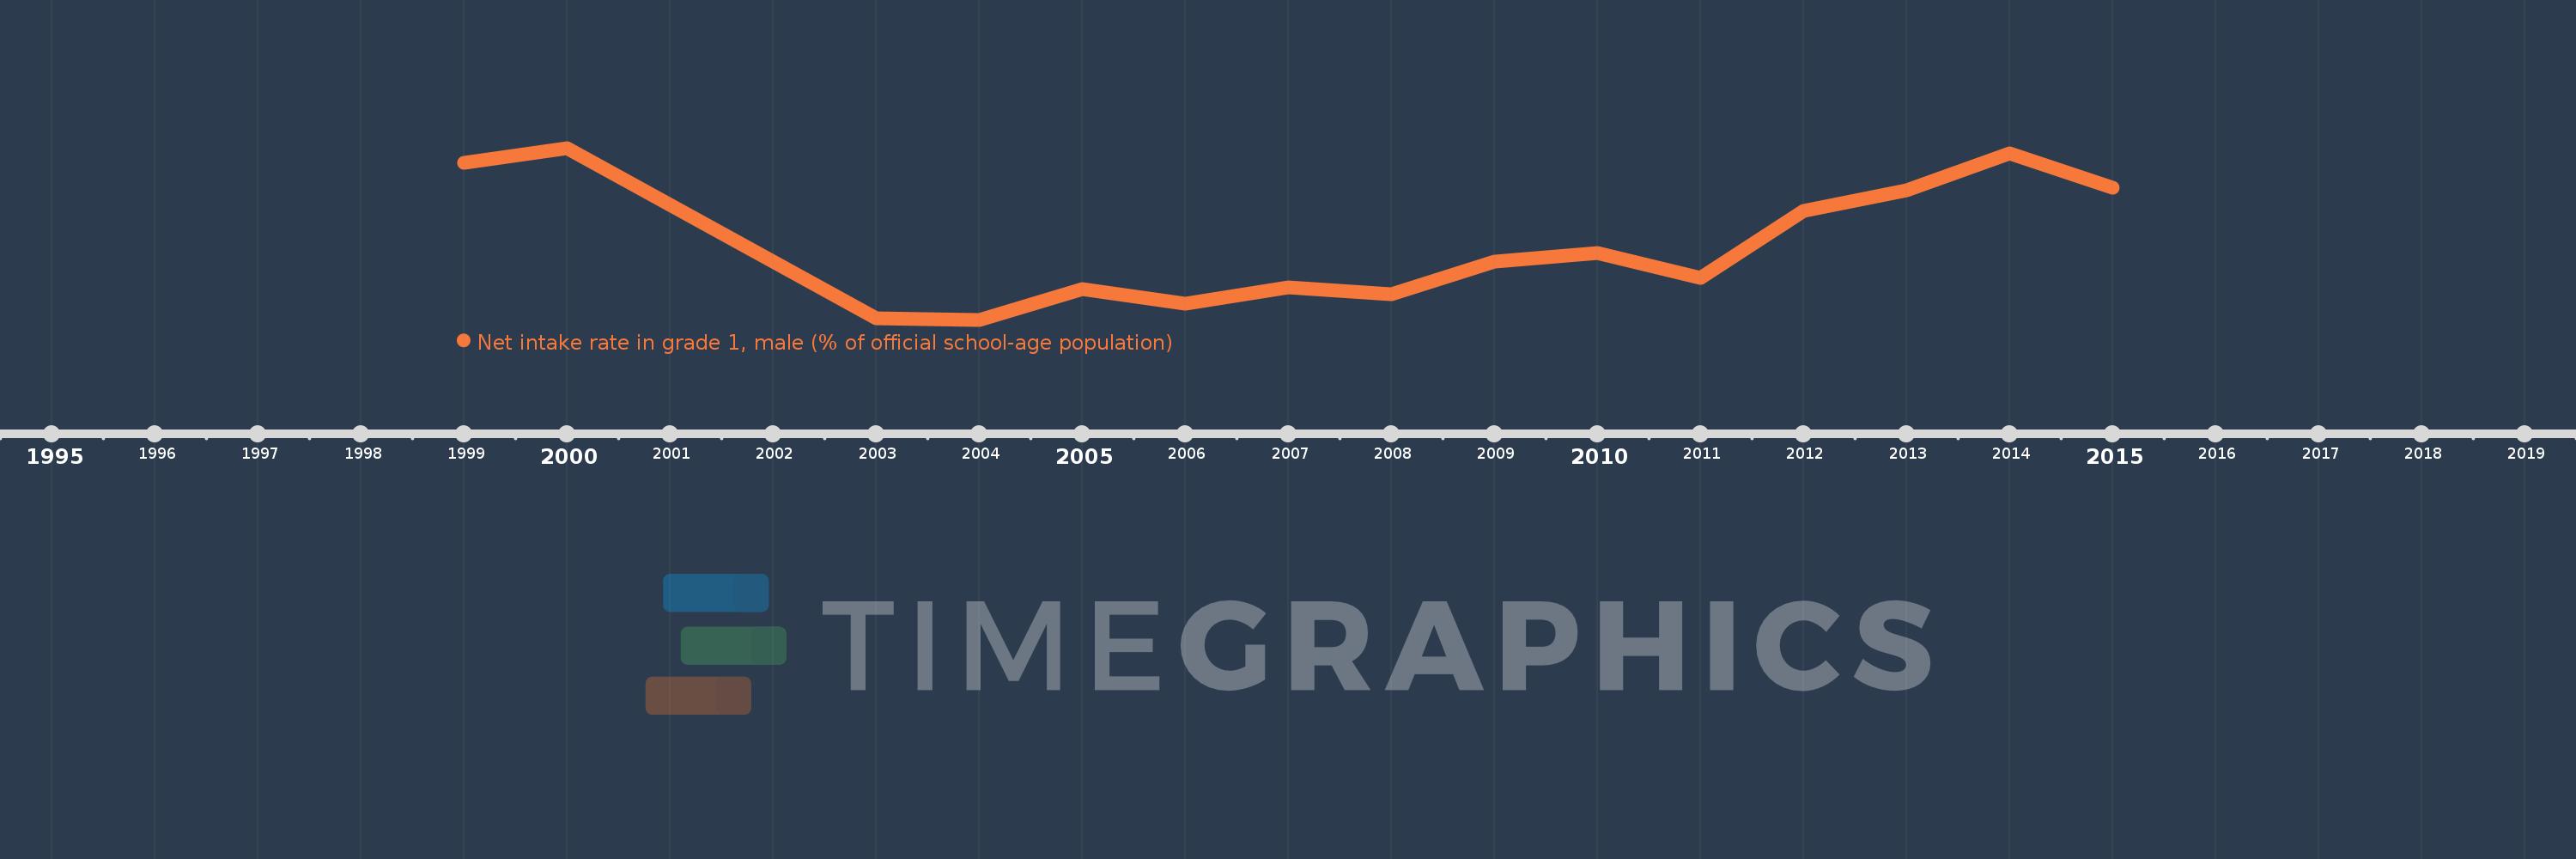
Questa scala temporale mostra un grafico dal 1999 anno al 2015 anno. Azerbaijan. I dati fino ad 1998 anno non disponibili. Il numero di osservazioni attuali secondo i date: 15.
La fonte (nome):
Indicatori dello sviluppo mondiale
La fonte (organizzazione):
United Nations Educational, Scientific, and Cultural Organization (UNESCO) Institute for Statistics.
Categorie:
Education, Gender
sono stati aggiornati
23 apr 2017 anni
Indicatori delle variazioni dei valori per anni
In media:
73.507
Minima:
64.419
1 gen 2004 anni
Massimo:
84.993
1 gen 2000 anni
Alla data di osservazione
Valore
Variazione assoluta
La variazione rispetto al valore precedente
1 gen 1999 anni
83.244
+83.244
0.0%
1 gen 2000 anni
84.993
+1.749
2.1%
1 gen 2003 anni
64.612
-20.381
-23.98%
1 gen 2004 anni
64.419
-0.193
-0.3%
1 gen 2005 anni
68.086
+3.667
5.69%
1 gen 2006 anni
66.303
-1.783
-2.62%
1 gen 2007 anni
68.333
+2.03
3.06%
1 gen 2008 anni
67.48
-0.853
-1.25%
1 gen 2009 anni
71.405
+3.925
5.82%
1 gen 2010 anni
72.42
+1.015
1.42%
1 gen 2011 anni
69.448
-2.972
-4.1%
1 gen 2012 anni
77.445
+7.998
11.52%
1 gen 2013 anni
79.919
+2.474
3.19%
1 gen 2014 anni
84.296
+4.377
5.48%
1 gen 2015 anni
80.202
-4.093
-4.86%
Classificazione dei paesi secondo i statistiche attuali per anni