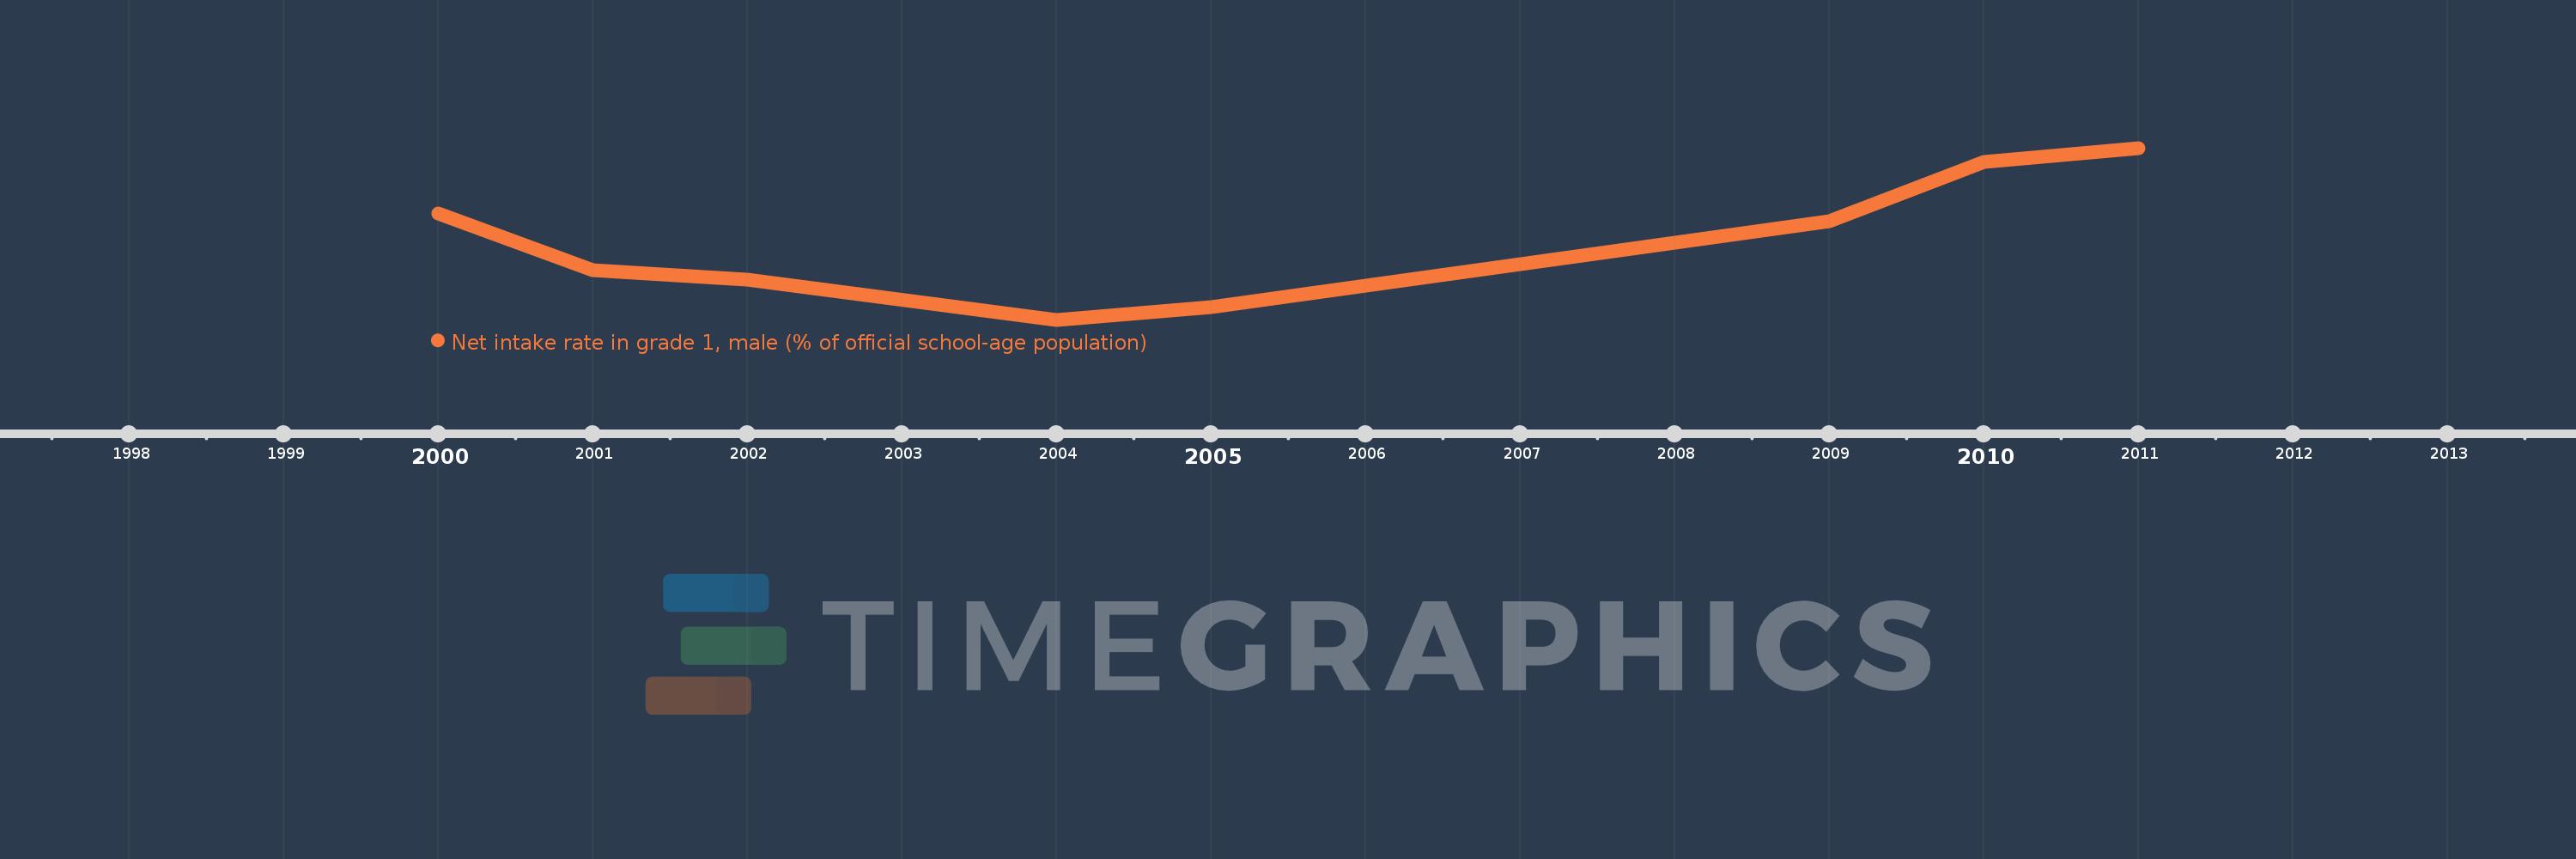
Questa scala temporale mostra un grafico dal 2000 anno al 2011 anno. Trinidad and Tobago. I dati fino ad 1999 anno non disponibili. Il numero di osservazioni attuali secondo i date: 8.
La fonte (nome):
Indicatori dello sviluppo mondiale
La fonte (organizzazione):
United Nations Educational, Scientific, and Cultural Organization (UNESCO) Institute for Statistics.
Categorie:
Education, Gender
sono stati aggiornati
23 apr 2017 anni
Indicatori delle variazioni dei valori per anni
In media:
67.064
Minima:
61.718
1 gen 2004 anni
Massimo:
73.257
1 gen 2011 anni
Alla data di osservazione
Valore
Variazione assoluta
La variazione rispetto al valore precedente
1 gen 2000 anni
68.849
+68.849
0.0%
1 gen 2001 anni
65.035
-3.814
-5.54%
1 gen 2002 anni
64.402
-0.633
-0.97%
1 gen 2004 anni
61.718
-2.684
-4.17%
1 gen 2005 anni
62.588
+0.87
1.41%
1 gen 2009 anni
68.361
+5.772
9.22%
1 gen 2010 anni
72.3
+3.94
5.76%
1 gen 2011 anni
73.257
+0.957
1.32%
Classificazione dei paesi secondo i statistiche attuali per anni