33
/it/
AIzaSyAYiBZKx7MnpbEhh9jyipgxe19OcubqV5w
May 1, 2025
286270
Zambia
ZMB
true
2
1
Net intake rate in grade 1, male (% of official school-age population)
2014,2013,2012,2011,2009,2008,2007,2006,2005,2003,2001,2000,1999
Download
Biblioteca di statistiche globali →Zambia →

Net intake rate in grade 1, male (% of official school-age population)

Queste statistiche in altri paesi:

AfghanistanAlbaniaAlgeriaAngolaAntigua and BarbudaArab WorldArmeniaArubaAzerbaijanBahamas, TheBahrainBangladeshBarbadosBelarusBelizeBeninBermudaBhutanBoliviaBosnia and HerzegovinaBotswanaBrunei DarussalamBulgariaBurkina FasoBurundiCabo VerdeCambodiaCameroonCaribbean small statesCentral African RepublicChadChileColombiaComorosCongo, Dem. Rep.Congo, Rep.Costa RicaCote d'IvoireCroatiaCubaCyprusDenmarkDjiboutiDominicaDominican RepublicEarly-demographic dividendEcuadorEgypt, Arab Rep.El SalvadorEquatorial GuineaEritreaEstoniaEthiopiaEuro areaEurope & Central AsiaEurope & Central Asia (excluding high income)Europe & Central Asia (IDA & IBRD countries)FijiFragile and conflict affected situationsGambia, TheGeorgiaGhanaGreeceGrenadaGuatemalaGuineaGuinea-BissauGuyanaHeavily indebted poor countries (HIPC)High incomeHondurasIcelandIDA & IBRD totalIDA onlyIDA totalIndonesiaIran, Islamic Rep.IraqIrelandItalyJapanJordanKazakhstanKenyaKorea, Dem. People’s Rep.Korea, Rep.KuwaitKyrgyz RepublicLao PDRLatin America & Caribbean Latin America & Caribbean (excluding high income)Latin America & the Caribbean (IDA & IBRD countries)Least developed countries: UN classificationLebanonLesothoLiberiaLiechtensteinLithuaniaLow & middle incomeLow incomeLuxembourgMacedonia, FYRMadagascarMalawiMaldivesMaliMaltaMarshall IslandsMauritaniaMauritiusMexicoMicronesia, Fed. Sts.Middle East & North AfricaMiddle East & North Africa (excluding high income)Middle East & North Africa (IDA & IBRD countries)MoldovaMongoliaMontenegroMoroccoMozambiqueNamibiaNauruNepalNicaraguaNigerNorth AmericaNorwayOECD membersOmanOther small statesPacific island small statesParaguayPeruPhilippinesPortugalPost-demographic dividendPre-demographic dividendPuerto RicoQatarRomaniaRwandaSamoaSan MarinoSao Tome and PrincipeSaudi ArabiaSenegalSerbiaSeychellesSierra LeoneSloveniaSmall statesSolomon IslandsSouth AfricaSpainSri LankaSt. Kitts and NevisSt. LuciaSt. Vincent and the GrenadinesSub-Saharan Africa Sub-Saharan Africa (excluding high income)Sub-Saharan Africa (IDA & IBRD countries)SurinameSwazilandSwedenSwitzerlandSyrian Arab RepublicTajikistanTanzaniaThailandTimor-LesteTogoTongaTrinidad and TobagoTunisiaTurkeyUgandaUkraineUnited Arab EmiratesUnited StatesUruguayUzbekistanVanuatuVenezuela, RBWest Bank and GazaWorldYemen, Rep.ZambiaZimbabwe

Linea del tempo:

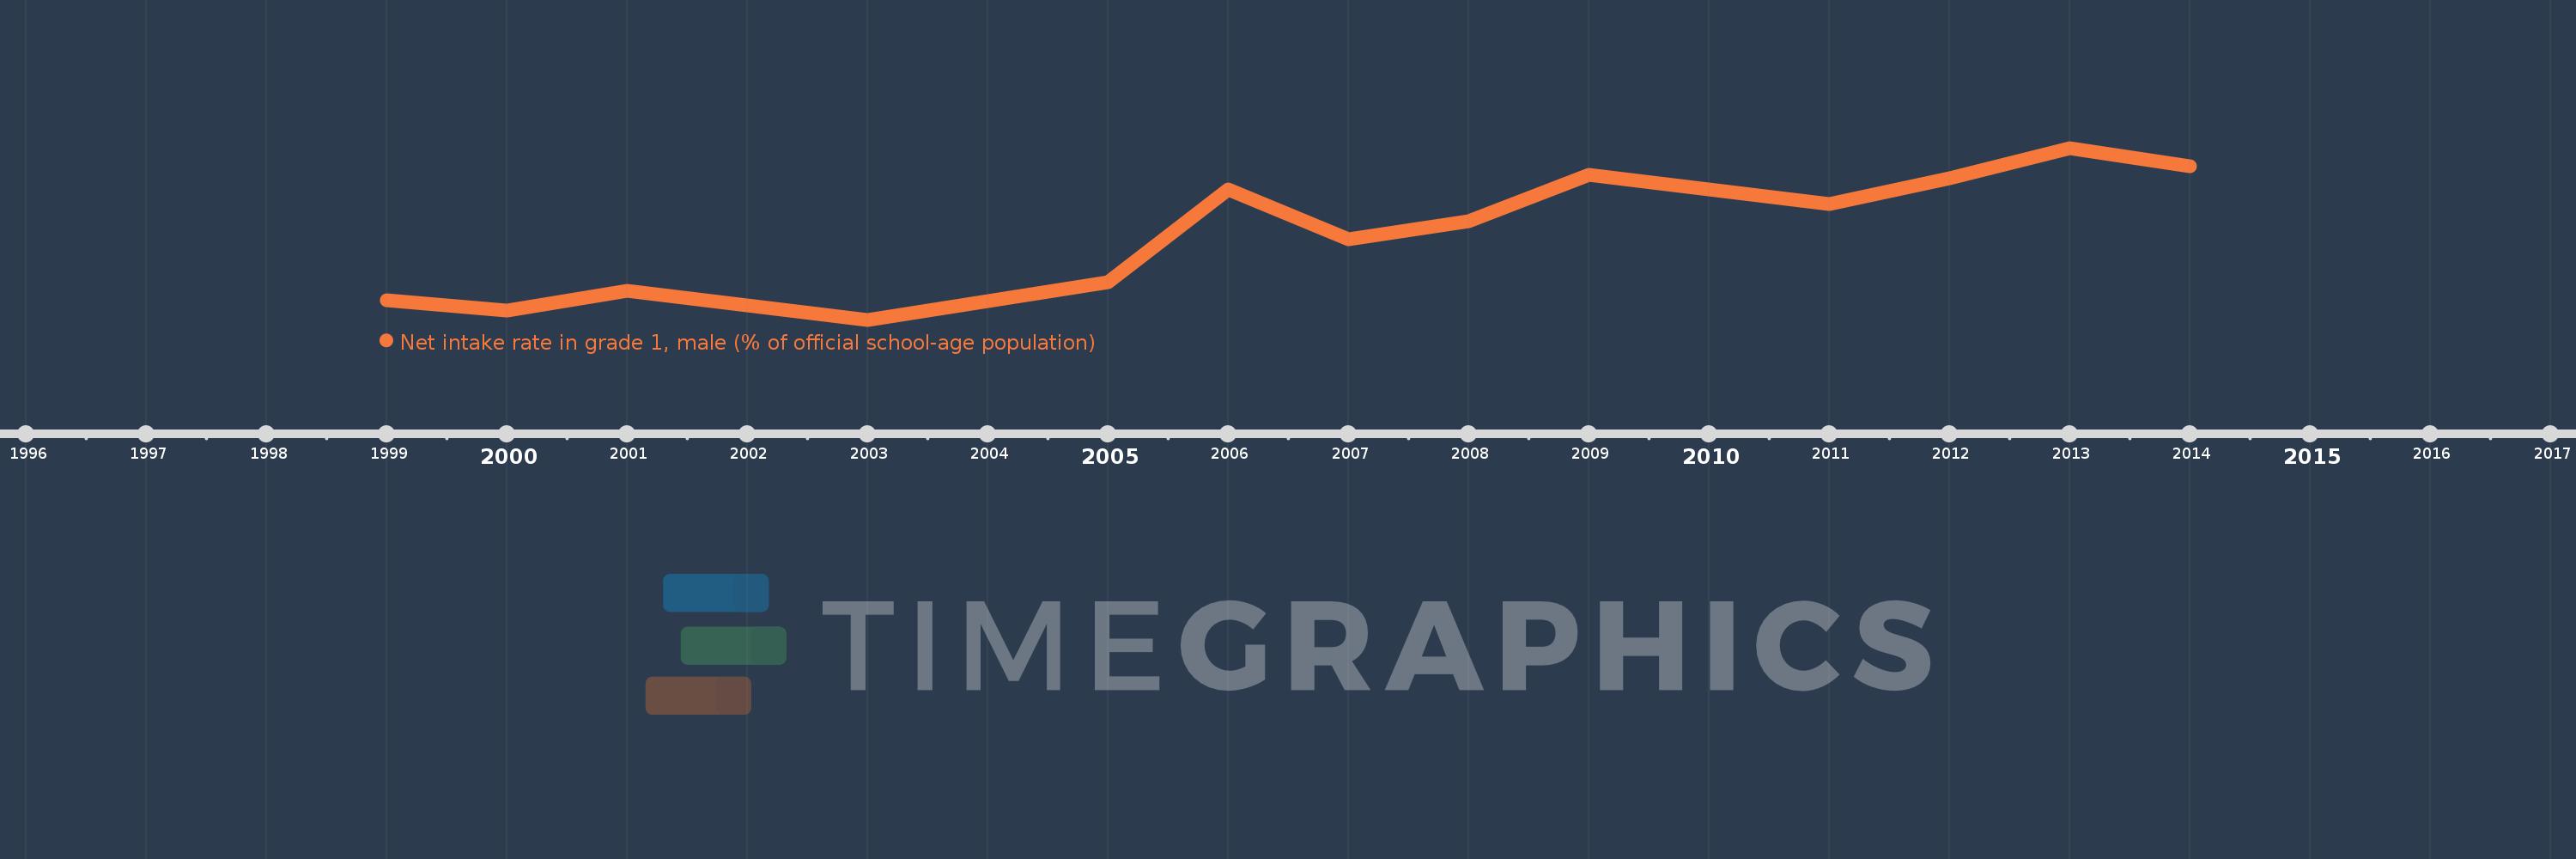
Questa scala temporale mostra un grafico dal 1999 anno al 2014 anno. Zambia. I dati fino ad 1998 anno non disponibili. Il numero di osservazioni attuali secondo i date: 13.

La fonte (nome):

Indicatori dello sviluppo mondiale

La fonte (organizzazione):

United Nations Educational, Scientific, and Cultural Organization (UNESCO) Institute for Statistics.

Categorie:

Education, Gender

sono stati aggiornati

23 apr 2017 anni

Indicatori delle variazioni dei valori per anni

In media:
42.024
Minima:
33.522
1 gen 2003 anni
Massimo:
50.291
1 gen 2013 anni
Alla data di osservazione
Valore
Variazione assoluta
La variazione rispetto al valore precedente
1 gen 1999 anni
35.464
+35.464
0.0%
1 gen 2000 anni
34.443
-1.021
-2.88%
1 gen 2001 anni
36.326
+1.883
5.47%
1 gen 2003 anni
33.522
-2.804
-7.72%
1 gen 2005 anni
37.156
+3.634
10.84%
1 gen 2006 anni
46.235
+9.079
24.43%
1 gen 2007 anni
41.4
-4.835
-10.46%
1 gen 2008 anni
43.163
+1.762
4.26%
1 gen 2009 anni
47.639
+4.476
10.37%
1 gen 2011 anni
44.825
-2.813
-5.91%
1 gen 2012 anni
47.323
+2.497
5.57%
1 gen 2013 anni
50.291
+2.968
6.27%
1 gen 2014 anni
48.531
-1.76
-3.5%

Classificazione dei paesi secondo i statistiche attuali per anni