33
/it/
AIzaSyB4mHJ5NPEv-XzF7P6NDYXjlkCWaeKw5bc
November 30, 2025
49309
Middle East & North Africa (excluding high income)
MNA
false
2
1
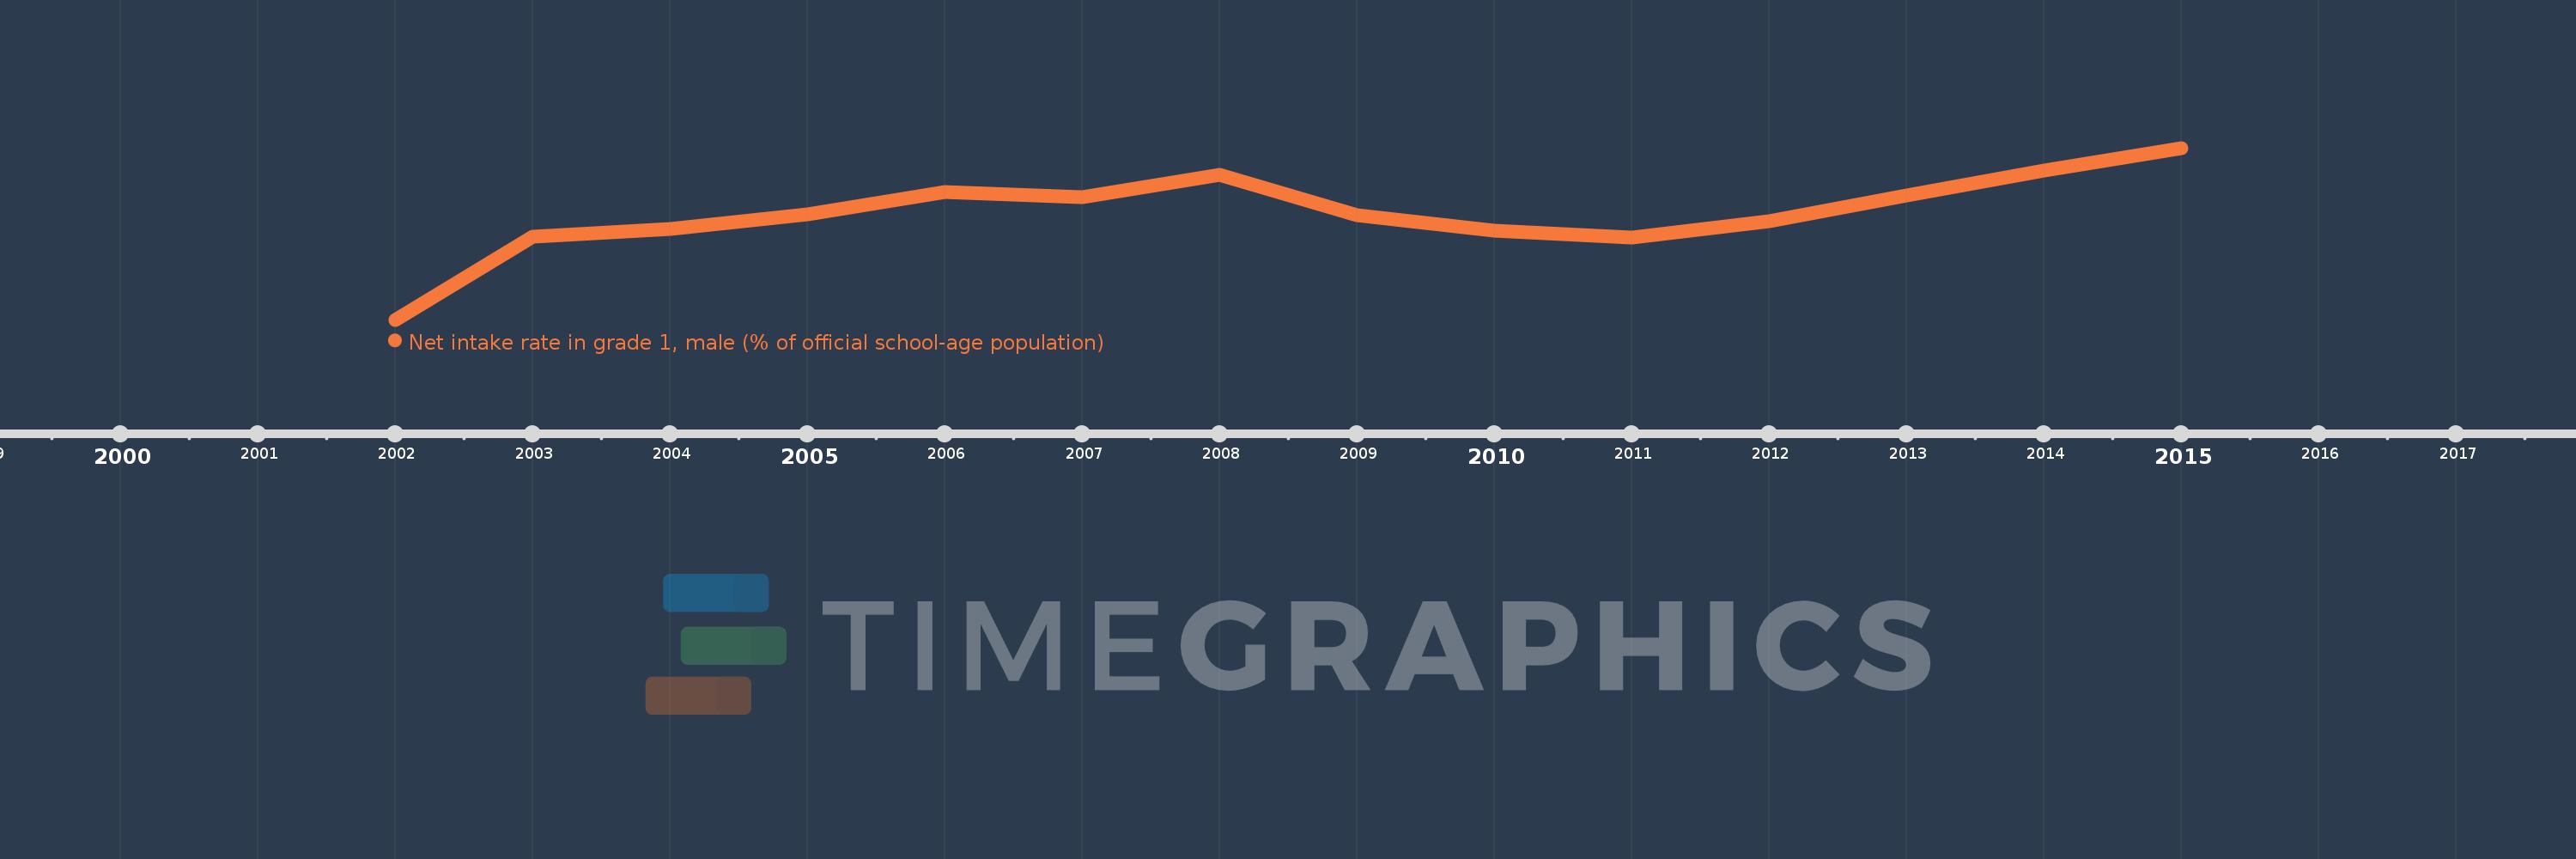
Net intake rate in grade 1, male (% of official school-age population)
2015,2014,2013,2012,2011,2010,2009,2008,2007,2006,2005,2004,2003,2002