Questa scala temporale mostra un grafico dal 1999 anno al 2015 anno. IDA only. I dati fino ad 1998 anno non disponibili. Il numero di osservazioni attuali secondo i date: 17.
La fonte (nome):
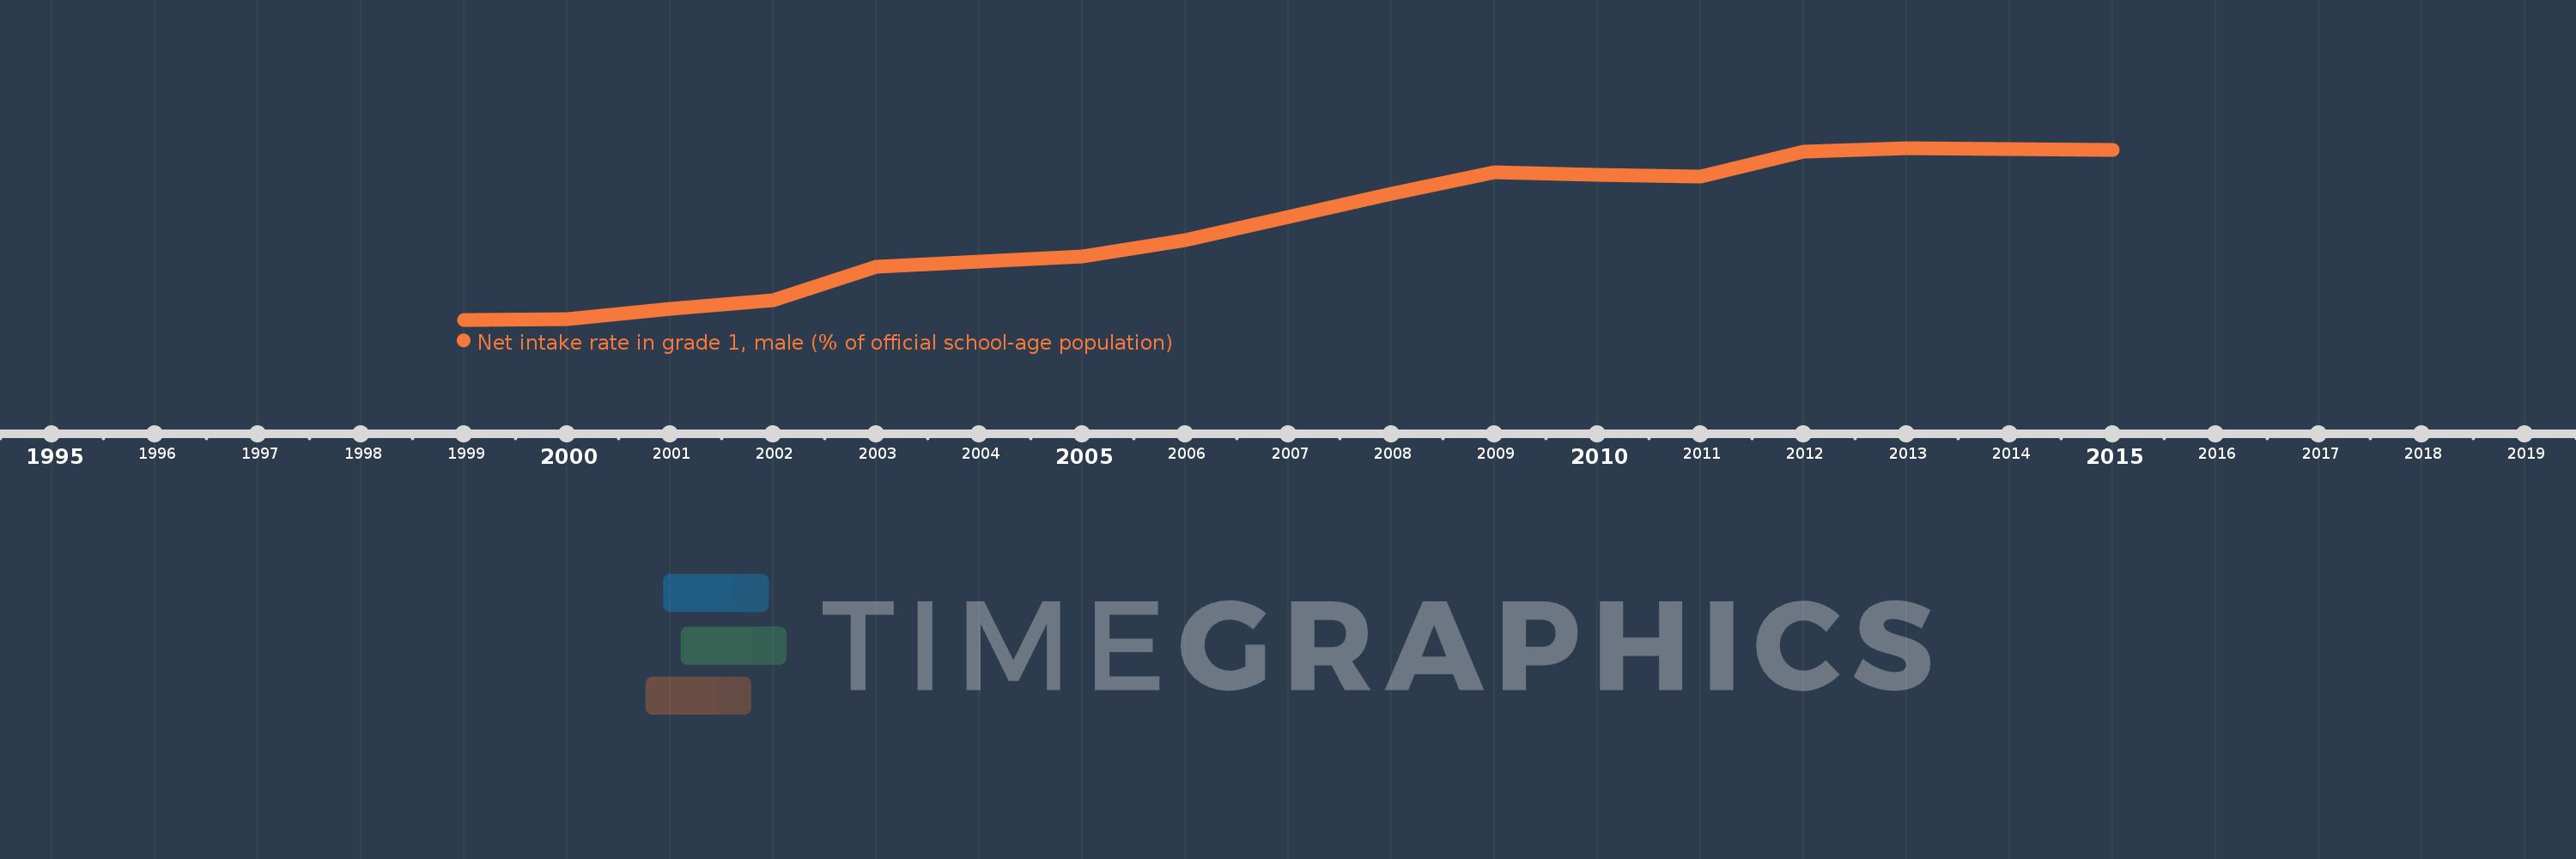
Indicatori dello sviluppo mondiale
La fonte (organizzazione):
United Nations Educational, Scientific, and Cultural Organization (UNESCO) Institute for Statistics.
Categorie:
Education, Gender
sono stati aggiornati
23 apr 2017 anni
Indicatori delle variazioni dei valori per anni
In media:
58.93
Minima:
48.72
1 gen 1999 anni
Massimo:
67.021
1 gen 2013 anni
Alla data di osservazione
Valore
Variazione assoluta
La variazione rispetto al valore precedente
1 gen 1999 anni
48.72
+48.72
0.0%
1 gen 2000 anni
48.751
+0.031
0.06%
1 gen 2001 anni
49.923
+1.172
2.4%
1 gen 2002 anni
50.827
+0.904
1.81%
1 gen 2003 anni
54.328
+3.501
6.89%
1 gen 2004 anni
54.907
+0.579
1.07%
1 gen 2005 anni
55.507
+0.6
1.09%
1 gen 2006 anni
57.215
+1.707
3.08%
1 gen 2007 anni
59.636
+2.421
4.23%
1 gen 2008 anni
62.127
+2.491
4.18%
1 gen 2009 anni
64.413
+2.286
3.68%
1 gen 2010 anni
64.127
-0.286
-0.44%
1 gen 2011 anni
64.018
-0.11
-0.17%
1 gen 2012 anni
66.583
+2.565
4.01%
1 gen 2013 anni
67.021
+0.438
0.66%
1 gen 2014 anni
66.91
-0.11
-0.16%
1 gen 2015 anni
66.792
-0.119
-0.18%
Classificazione dei paesi secondo i statistiche attuali per anni