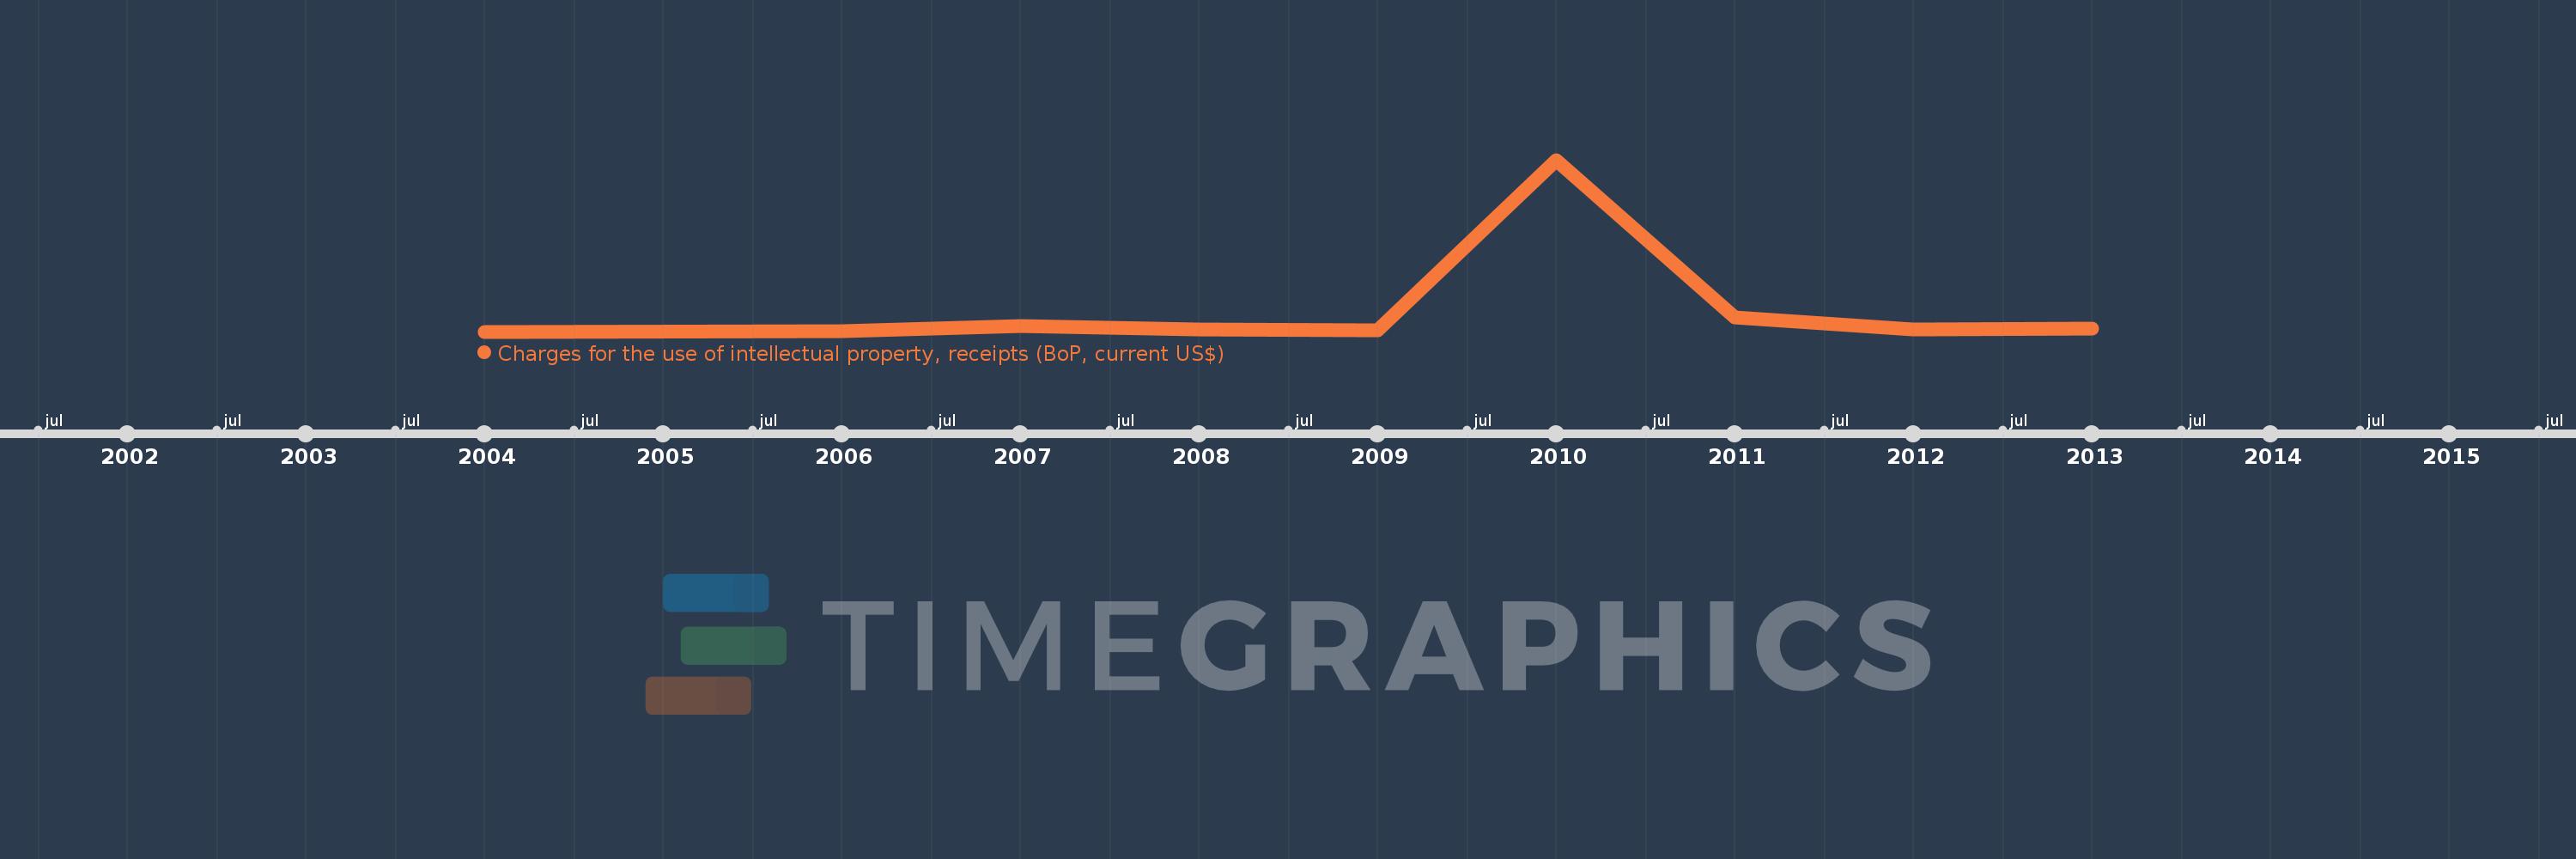
Questa scala temporale mostra un grafico dal 2004 anno al 2013 anno. Azerbaijan. I dati fino ad 2003 anno non disponibili. Il numero di osservazioni attuali secondo i date: 9.
La fonte (nome):
Indicatori dello sviluppo mondiale
La fonte (organizzazione):
International Monetary Fund, Balance of Payments Statistics Yearbook and data files.
Categorie:
Economy & Growth, Science & Technology
sono stati aggiornati
23 apr 2017 anni
Indicatori delle variazioni dei valori per anni
In media:
233.111 Mille.
Minima:
1000.0
1 gen 2004 anni
Massimo:
1.8 Mln
1 gen 2010 anni
Alla data di osservazione
Valore
Variazione assoluta
La variazione rispetto al valore precedente
1 gen 2004 anni
1000.0
+1000.0
0.0%
1 gen 2006 anni
6.0 Mille.
+5.0 Mille.
500.0%
1 gen 2007 anni
56.0 Mille.
+50.0 Mille.
833.33%
1 gen 2008 anni
22.0 Mille.
-34.0 Mille.
-60.71%
1 gen 2009 anni
13.0 Mille.
-9.0 Mille.
-40.91%
1 gen 2010 anni
1.8 Mln
+1.787 Mln
13.75 Mille.%
1 gen 2011 anni
149.0 Mille.
-1.651 Mln
-91.72%
1 gen 2012 anni
23.0 Mille.
-126.0 Mille.
-84.56%
1 gen 2013 anni
28.0 Mille.
+5.0 Mille.
21.74%
Classificazione dei paesi secondo i statistiche attuali per anni