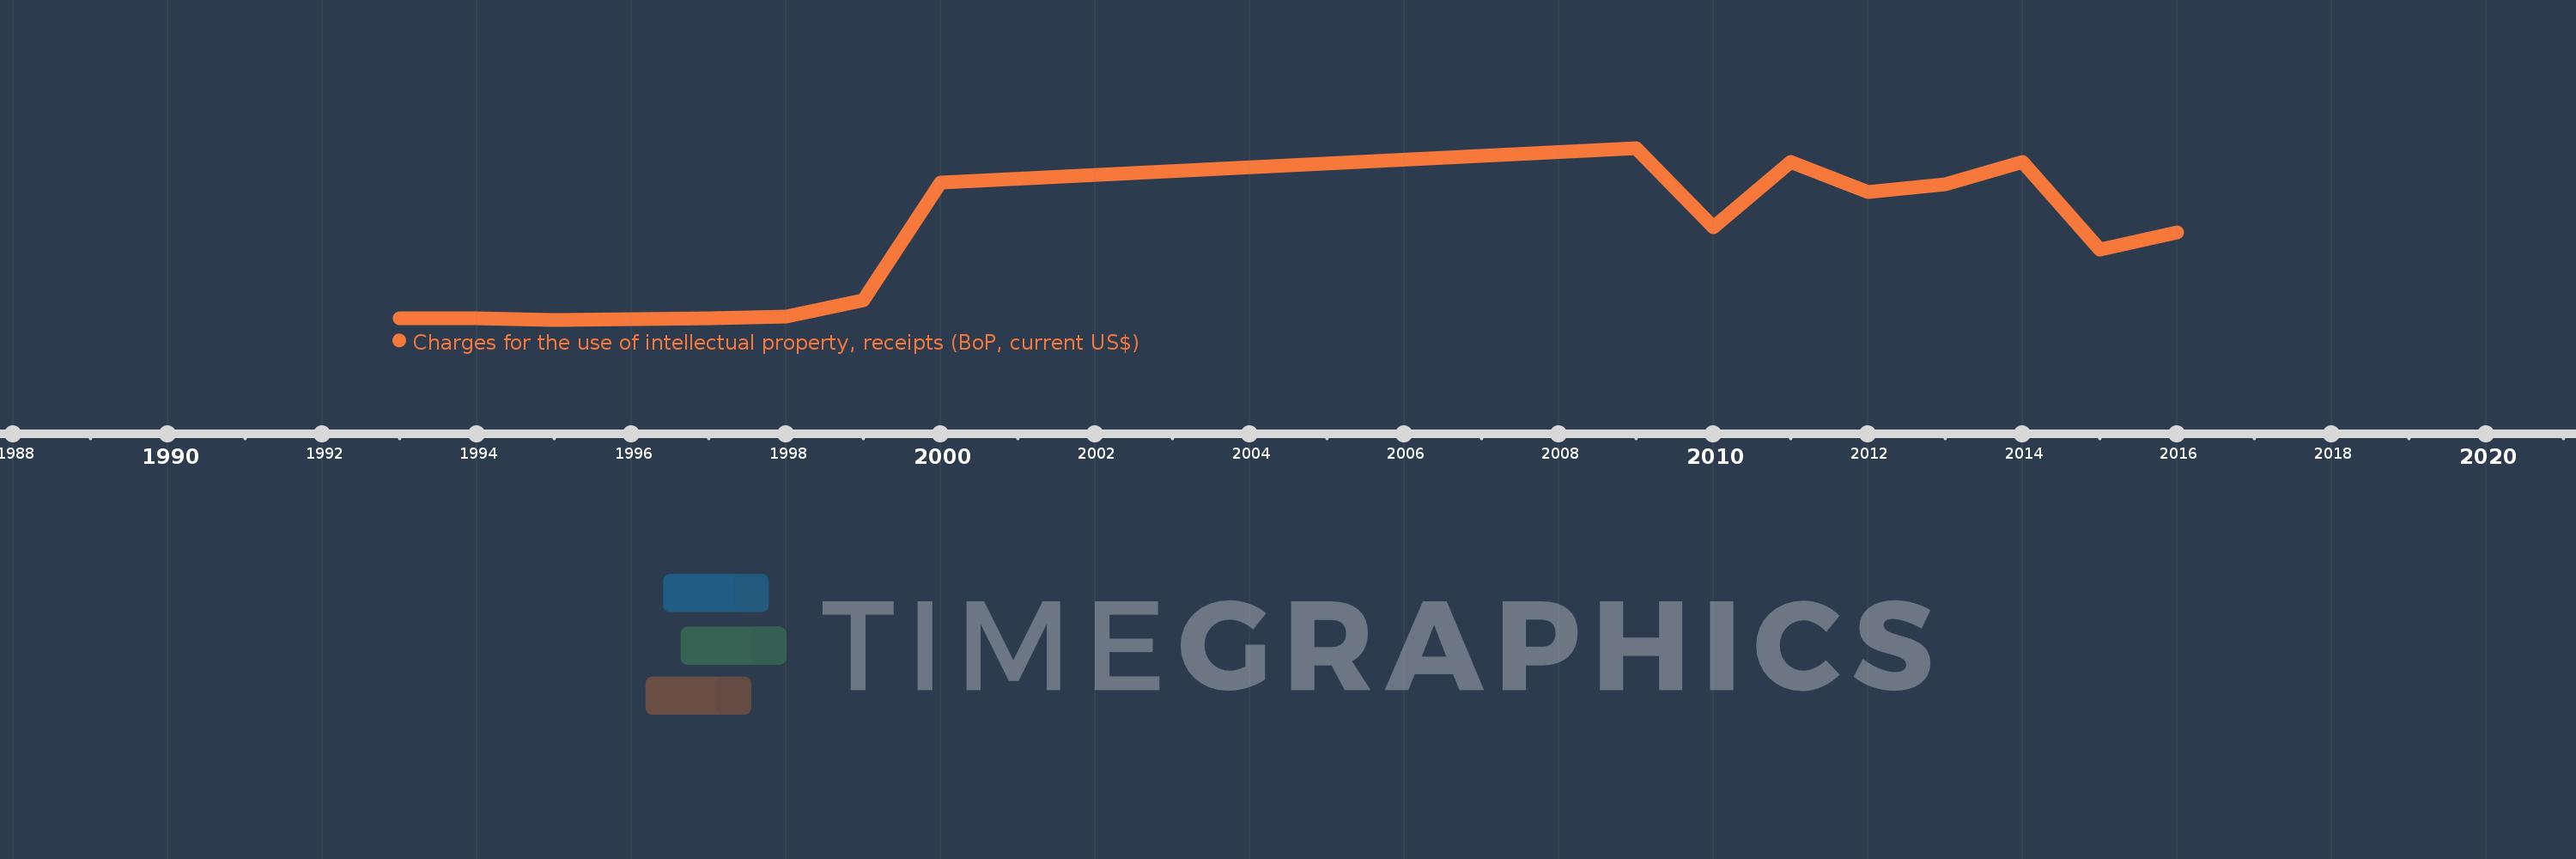
Questa scala temporale mostra un grafico dal 1993 anno al 2016 anno. Latvia. I dati fino ad 1992 anno non disponibili. Il numero di osservazioni attuali secondo i date: 15.
La fonte (nome):
Indicatori dello sviluppo mondiale
La fonte (organizzazione):
International Monetary Fund, Balance of Payments Statistics Yearbook and data files.
Categorie:
Economy & Growth, Science & Technology
sono stati aggiornati
23 apr 2017 anni
Indicatori delle variazioni dei valori per anni
In media:
5.895 Mln
Minima:
12.0 Mille.
1 gen 1995 anni
Massimo:
13.023 Mln
1 gen 2009 anni
Alla data di osservazione
Valore
Variazione assoluta
La variazione rispetto al valore precedente
1 gen 1993 anni
149.355 Mille.
+149.355 Mille.
0.0%
1 gen 1994 anni
133.0 Mille.
-16.355 Mille.
-10.95%
1 gen 1995 anni
12.0 Mille.
-121.0 Mille.
-90.98%
1 gen 1997 anni
97.0 Mille.
+85.0 Mille.
708.33%
1 gen 1998 anni
236.0 Mille.
+139.0 Mille.
143.3%
1 gen 1999 anni
1.5 Mln
+1.264 Mln
535.59%
1 gen 2000 anni
10.4 Mln
+8.9 Mln
593.33%
1 gen 2009 anni
13.023 Mln
+2.623 Mln
25.22%
1 gen 2010 anni
7.0 Mln
-6.023 Mln
-46.25%
1 gen 2011 anni
11.967 Mln
+4.967 Mln
70.96%
1 gen 2012 anni
9.718 Mln
-2.249 Mln
-18.8%
1 gen 2013 anni
10.282 Mln
+564.407 Mille.
5.81%
1 gen 2014 anni
11.931 Mln
+1.649 Mln
16.04%
1 gen 2015 anni
5.315 Mln
-6.616 Mln
-55.46%
1 gen 2016 anni
6.657 Mln
+1.343 Mln
25.27%
Classificazione dei paesi secondo i statistiche attuali per anni