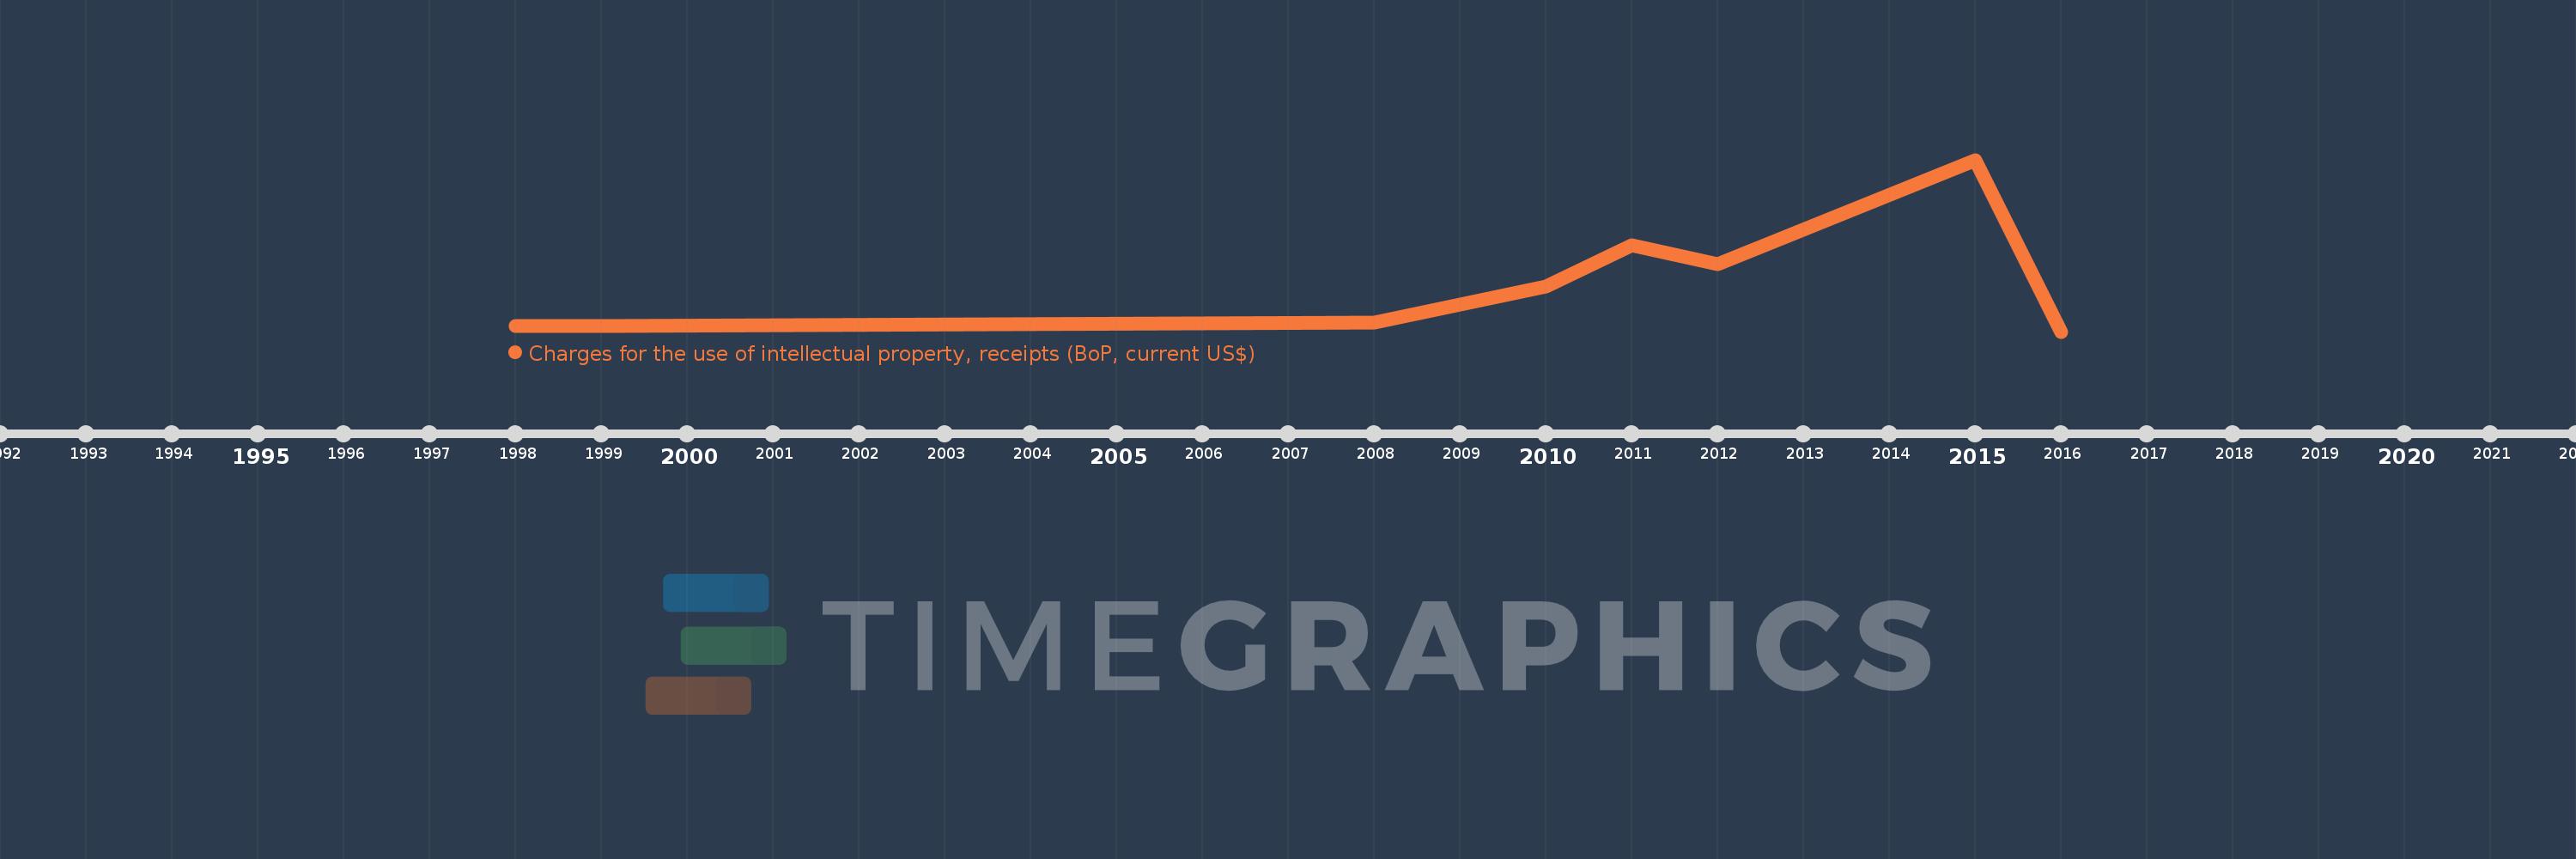
Questa scala temporale mostra un grafico dal 1998 anno al 2016 anno. Sudan. I dati fino ad 1997 anno non disponibili. Il numero di osservazioni attuali secondo i date: 8.
La fonte (nome):
Indicatori dello sviluppo mondiale
La fonte (organizzazione):
International Monetary Fund, Balance of Payments Statistics Yearbook and data files.
Categorie:
Economy & Growth, Science & Technology
sono stati aggiornati
23 apr 2017 anni
Indicatori delle variazioni dei valori per anni
In media:
1.639 Mln
Minima:
479.029
1 gen 2016 anni
Massimo:
5.745 Mln
1 gen 2015 anni
Alla data di osservazione
Valore
Variazione assoluta
La variazione rispetto al valore precedente
1 gen 1998 anni
200.0 Mille.
+200.0 Mille.
0.0%
1 gen 1999 anni
200.0 Mille.
0.0
0.0%
1 gen 2008 anni
300.555 Mille.
+100.555 Mille.
50.28%
1 gen 2010 anni
1.522 Mln
+1.222 Mln
406.42%
1 gen 2011 anni
2.878 Mln
+1.356 Mln
89.12%
1 gen 2012 anni
2.266 Mln
-612.298 Mille.
-21.27%
1 gen 2015 anni
5.745 Mln
+3.479 Mln
153.52%
1 gen 2016 anni
479.029
-5.745 Mln
-99.99%
Classificazione dei paesi secondo i statistiche attuali per anni