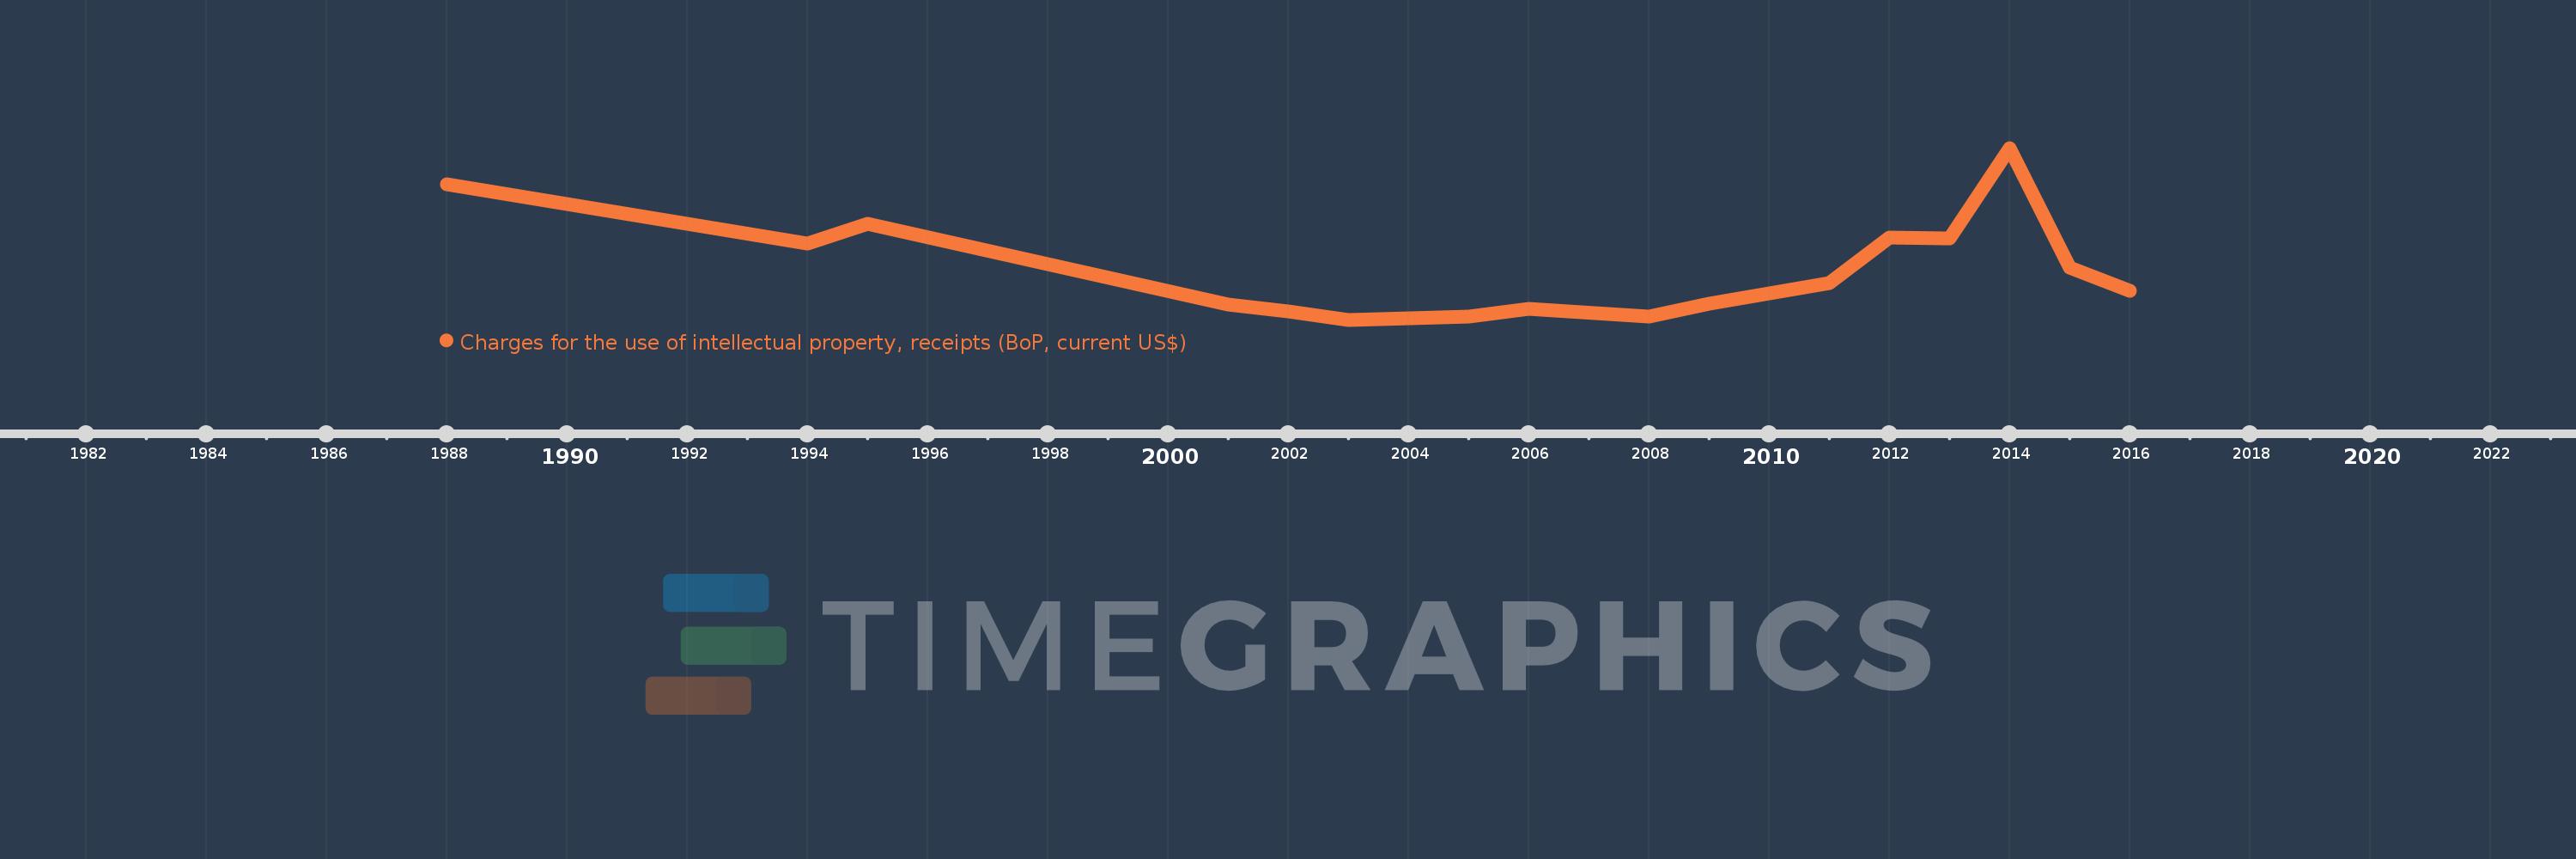
Questa scala temporale mostra un grafico dal 1988 anno al 2016 anno. Uruguay. I dati fino ad 1987 anno non disponibili. Il numero di osservazioni attuali secondo i date: 17.
La fonte (nome):
Indicatori dello sviluppo mondiale
La fonte (organizzazione):
International Monetary Fund, Balance of Payments Statistics Yearbook and data files.
Categorie:
Economy & Growth, Science & Technology
sono stati aggiornati
23 apr 2017 anni
Indicatori delle variazioni dei valori per anni
In media:
266.34 Mille.
Minima:
16.0 Mille.
1 gen 2003 anni
Massimo:
884.0 Mille.
1 gen 2014 anni
Alla data di osservazione
Valore
Variazione assoluta
La variazione rispetto al valore precedente
1 gen 1988 anni
700.0 Mille.
+700.0 Mille.
0.0%
1 gen 1994 anni
400.0 Mille.
-300.0 Mille.
-42.86%
1 gen 1995 anni
500.0 Mille.
+100.0 Mille.
25.0%
1 gen 2001 anni
91.0 Mille.
-409.0 Mille.
-81.8%
1 gen 2002 anni
56.0 Mille.
-35.0 Mille.
-38.46%
1 gen 2003 anni
16.0 Mille.
-40.0 Mille.
-71.43%
1 gen 2005 anni
33.788 Mille.
+17.788 Mille.
111.17%
1 gen 2006 anni
71.0 Mille.
+37.212 Mille.
110.13%
1 gen 2008 anni
30.0 Mille.
-41.0 Mille.
-57.75%
1 gen 2009 anni
96.0 Mille.
+66.0 Mille.
220.0%
1 gen 2010 anni
148.0 Mille.
+52.0 Mille.
54.17%
1 gen 2011 anni
201.0 Mille.
+53.0 Mille.
35.81%
1 gen 2012 anni
430.0 Mille.
+229.0 Mille.
113.93%
1 gen 2013 anni
429.0 Mille.
-1000.0
-0.23%
1 gen 2014 anni
884.0 Mille.
+455.0 Mille.
106.06%
1 gen 2015 anni
278.0 Mille.
-606.0 Mille.
-68.55%
1 gen 2016 anni
164.0 Mille.
-114.0 Mille.
-41.01%
Classificazione dei paesi secondo i statistiche attuali per anni