33
/it/
AIzaSyAYiBZKx7MnpbEhh9jyipgxe19OcubqV5w
August 1, 2025
63288
Afghanistan
AFG
true
2
1
Charges for the use of intellectual property, receipts (BoP, current US$)
2016,2015,2012,2010,2009
Download
Biblioteca di statistiche globali →Afghanistan →

Charges for the use of intellectual property, receipts (BoP, current US$)

Queste statistiche in altri paesi:

AfghanistanAlbaniaAlgeriaAngolaArab WorldArgentinaArubaAustraliaAustriaAzerbaijanBangladeshBarbadosBelarusBelgiumBelizeBeninBermudaBhutanBoliviaBosnia and HerzegovinaBotswanaBrazilBulgariaBurkina FasoBurundiCabo VerdeCambodiaCameroonCanadaCaribbean small statesCentral Europe and the BalticsChileChinaColombiaComorosCongo, Dem. Rep.Costa RicaCote d'IvoireCroatiaCuracaoCyprusCzech RepublicDenmarkDominicaEarly-demographic dividendEast Asia & PacificEast Asia & Pacific (excluding high income)East Asia & Pacific (IDA & IBRD countries)Egypt, Arab Rep.El SalvadorEritreaEstoniaEthiopiaEuro areaEurope & Central AsiaEurope & Central Asia (excluding high income)Europe & Central Asia (IDA & IBRD countries)European UnionFaroe IslandsFijiFinlandFragile and conflict affected situationsFranceFrench PolynesiaGeorgiaGermanyGreeceGrenadaGuatemalaGuineaGuyanaHaitiHeavily indebted poor countries (HIPC)High incomeHondurasHong Kong SAR, ChinaHungaryIBRD onlyIcelandIDA & IBRD totalIDA blendIDA onlyIDA totalIndiaIndonesiaIraqIrelandIsraelItalyJamaicaJapanJordanKazakhstanKenyaKiribatiKorea, Rep.KosovoKyrgyz RepublicLate-demographic dividendLatin America & Caribbean Latin America & Caribbean (excluding high income)Latin America & the Caribbean (IDA & IBRD countries)LatviaLeast developed countries: UN classificationLebanonLesothoLiberiaLibyaLithuaniaLow & middle incomeLow incomeLower middle incomeLuxembourgMacedonia, FYRMadagascarMalaysiaMaldivesMaliMaltaMauritiusMexicoMiddle East & North AfricaMiddle East & North Africa (excluding high income)Middle East & North Africa (IDA & IBRD countries)Middle incomeMoldovaMongoliaMontenegroMoroccoMozambiqueMyanmarNamibiaNetherlandsNew CaledoniaNew ZealandNigerNigeriaNorth AmericaNorwayOECD membersOther small statesPacific island small statesPakistanPanamaParaguayPeruPhilippinesPolandPortugalPost-demographic dividendPre-demographic dividendRomaniaRussian FederationRwandaSamoaSenegalSerbiaSeychellesSierra LeoneSingaporeSint Maarten (Dutch part)Slovak RepublicSloveniaSmall statesSolomon IslandsSouth AfricaSouth AsiaSouth Asia (IDA & IBRD)SpainSt. Kitts and NevisSt. Vincent and the GrenadinesSub-Saharan Africa Sub-Saharan Africa (excluding high income)Sub-Saharan Africa (IDA & IBRD countries)SudanSurinameSwazilandSwedenSwitzerlandSyrian Arab RepublicTajikistanTanzaniaThailandTogoTunisiaTuvaluUgandaUkraineUnited KingdomUnited StatesUpper middle incomeUruguayVanuatuWest Bank and GazaWorldYemen, Rep.Zimbabwe

Linea del tempo:

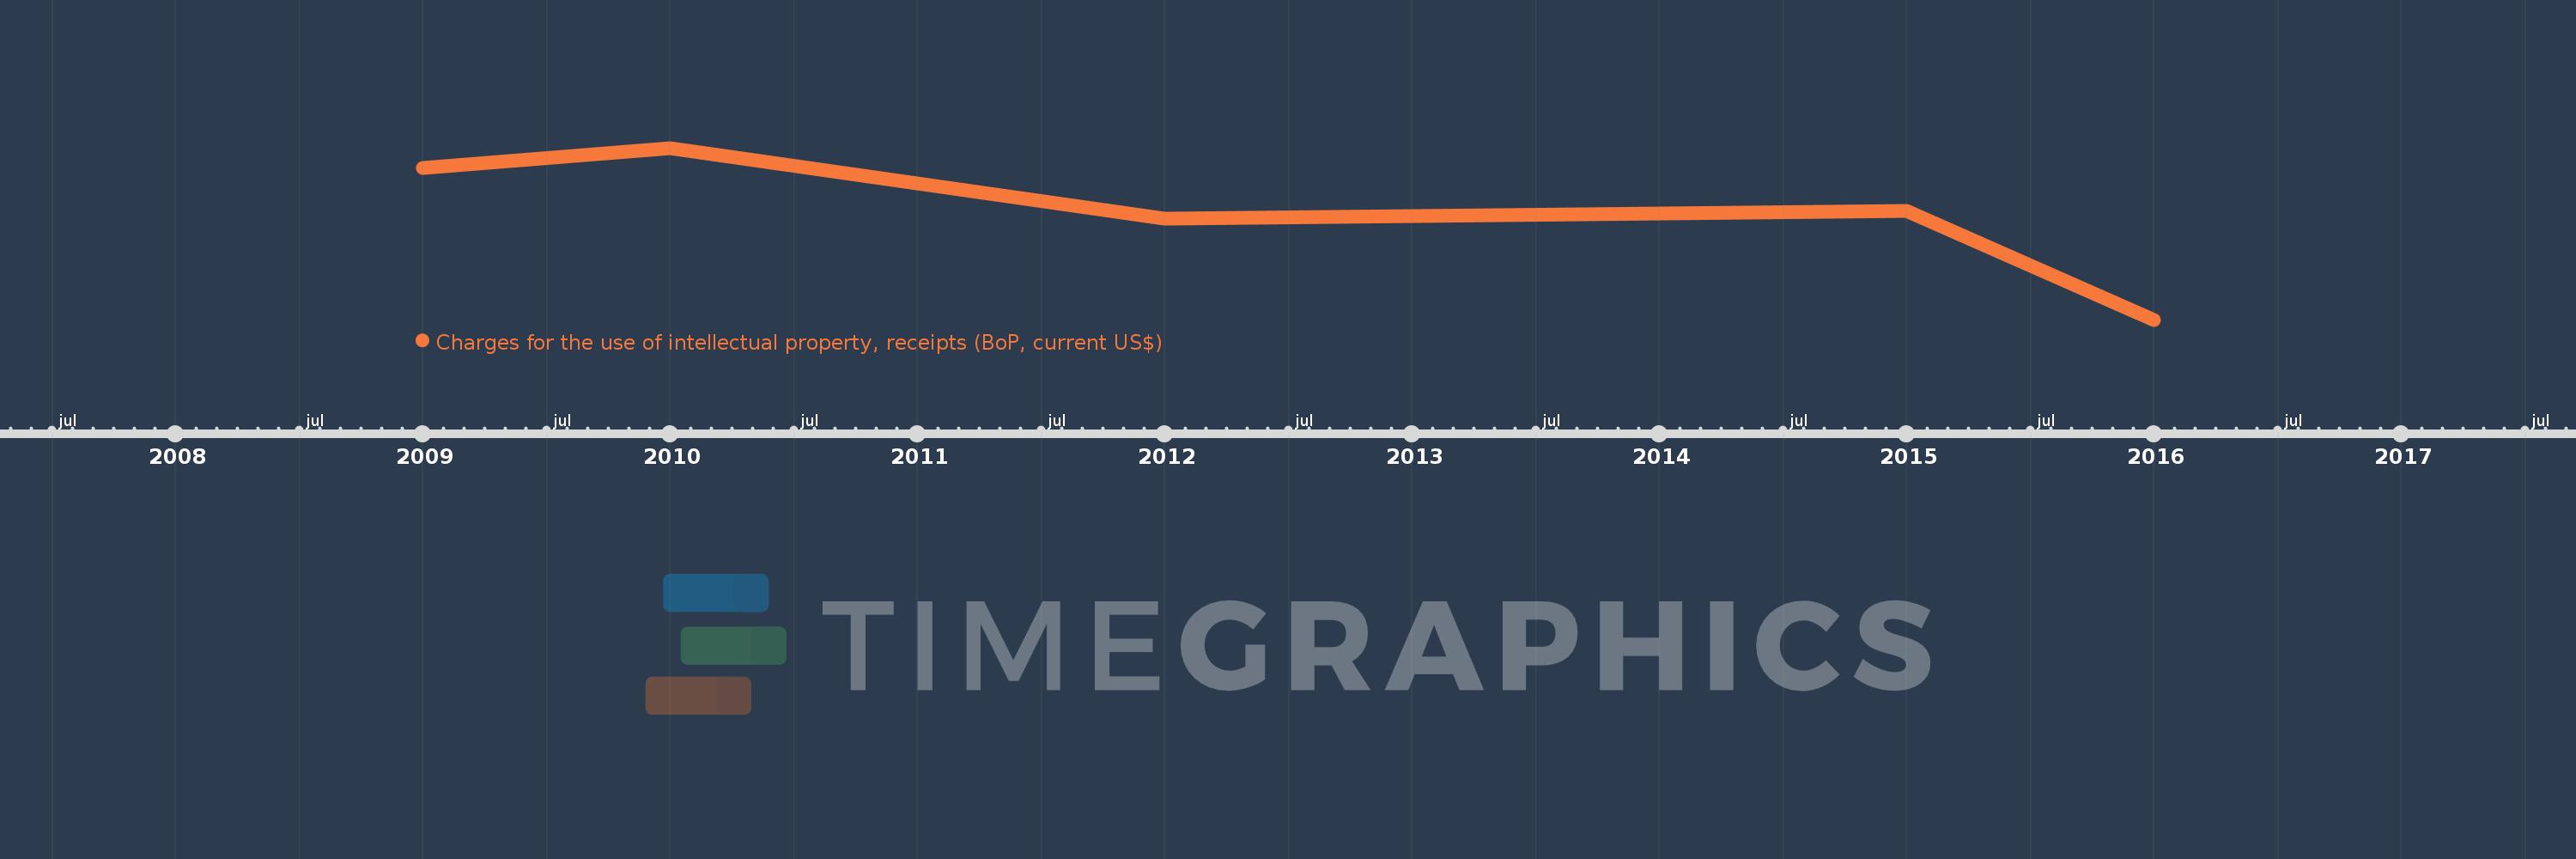
Questa scala temporale mostra un grafico dal 2009 anno al 2016 anno. Afghanistan. I dati fino ad 2008 anno non disponibili. Il numero di osservazioni attuali secondo i date: 5.

La fonte (nome):

Indicatori dello sviluppo mondiale

La fonte (organizzazione):

International Monetary Fund, Balance of Payments Statistics Yearbook and data files.

Categorie:

Economy & Growth, Science & Technology

sono stati aggiornati

23 apr 2017 anni

Indicatori delle variazioni dei valori per anni

In media:
456.229 Mille.
Minima:
10.268 Mille.
1 gen 2016 anni
Massimo:
727.817 Mille.
1 gen 2010 anni
Alla data di osservazione
Valore
Variazione assoluta
La variazione rispetto al valore precedente
1 gen 2009 anni
643.175 Mille.
+643.175 Mille.
0.0%
1 gen 2010 anni
727.817 Mille.
+84.643 Mille.
13.16%
1 gen 2012 anni
433.679 Mille.
-294.138 Mille.
-40.41%
1 gen 2015 anni
466.204 Mille.
+32.524 Mille.
7.5%
1 gen 2016 anni
10.268 Mille.
-455.935 Mille.
-97.8%

Classificazione dei paesi secondo i statistiche attuali per anni