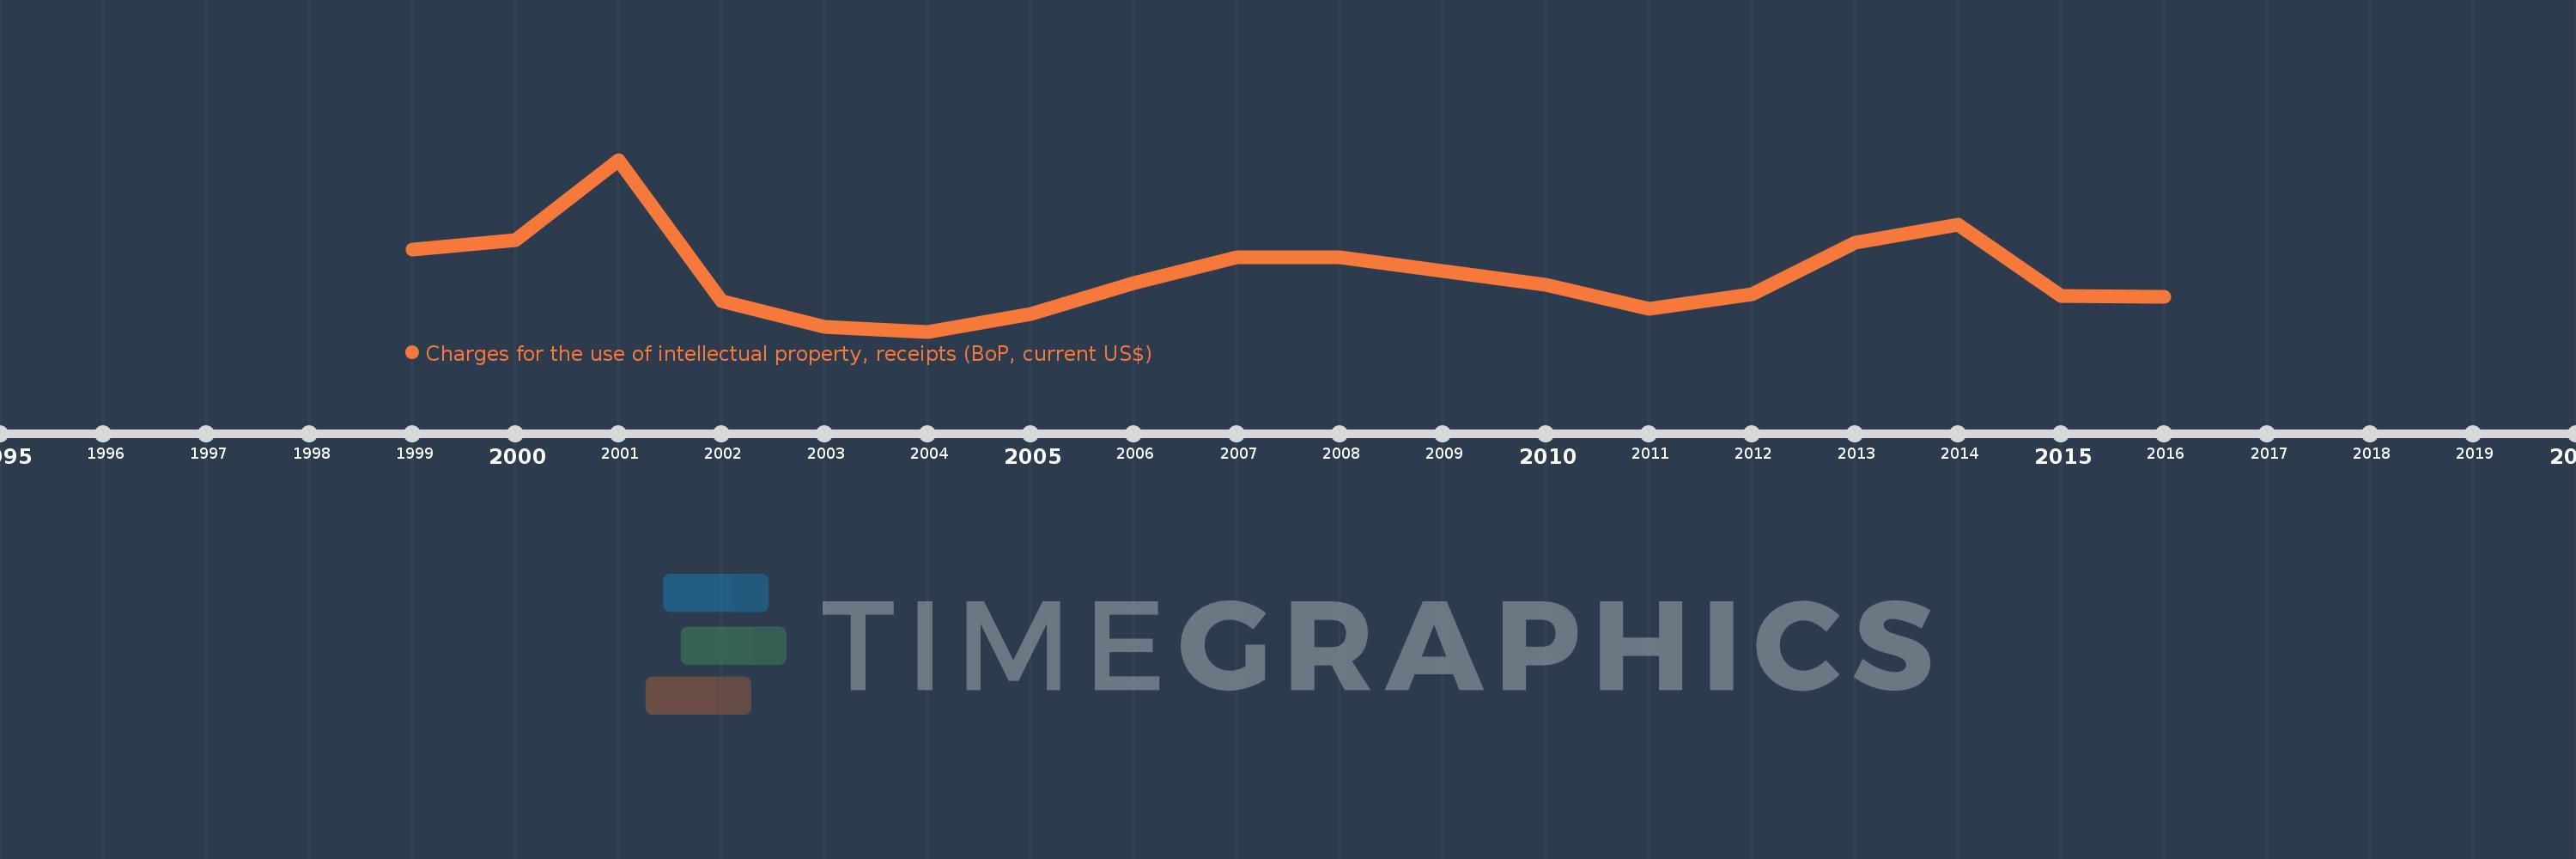
Questa scala temporale mostra un grafico dal 1999 anno al 2016 anno. Kyrgyz Republic. I dati fino ad 1998 anno non disponibili. Il numero di osservazioni attuali secondo i date: 17.
La fonte (nome):
Indicatori dello sviluppo mondiale
La fonte (organizzazione):
International Monetary Fund, Balance of Payments Statistics Yearbook and data files.
Categorie:
Economy & Growth, Science & Technology
sono stati aggiornati
23 apr 2017 anni
Indicatori delle variazioni dei valori per anni
In media:
1.948 Mln
Minima:
512.354 Mille.
1 gen 2004 anni
Massimo:
4.835 Mln
1 gen 2001 anni
Alla data di osservazione
Valore
Variazione assoluta
La variazione rispetto al valore precedente
1 gen 1999 anni
2.57 Mln
+2.57 Mln
0.0%
1 gen 2000 anni
2.816 Mln
+246.38 Mille.
9.59%
1 gen 2001 anni
4.835 Mln
+2.019 Mln
71.68%
1 gen 2002 anni
1.286 Mln
-3.549 Mln
-73.4%
1 gen 2003 anni
632.714 Mille.
-653.486 Mille.
-50.81%
1 gen 2004 anni
512.354 Mille.
-120.359 Mille.
-19.02%
1 gen 2005 anni
961.306 Mille.
+448.952 Mille.
87.63%
1 gen 2006 anni
1.738 Mln
+777.105 Mille.
80.84%
1 gen 2007 anni
2.383 Mln
+644.427 Mille.
37.07%
1 gen 2008 anni
2.391 Mln
+7.906 Mille.
0.33%
1 gen 2010 anni
1.69 Mln
-700.411 Mille.
-29.3%
1 gen 2011 anni
1.095 Mln
-595.799 Mille.
-35.25%
1 gen 2012 anni
1.45 Mln
+355.248 Mille.
32.46%
1 gen 2013 anni
2.745 Mln
+1.295 Mln
89.36%
1 gen 2014 anni
3.207 Mln
+461.698 Mille.
16.82%
1 gen 2015 anni
1.406 Mln
-1.801 Mln
-56.17%
1 gen 2016 anni
1.394 Mln
-11.487 Mille.
-0.82%
Classificazione dei paesi secondo i statistiche attuali per anni