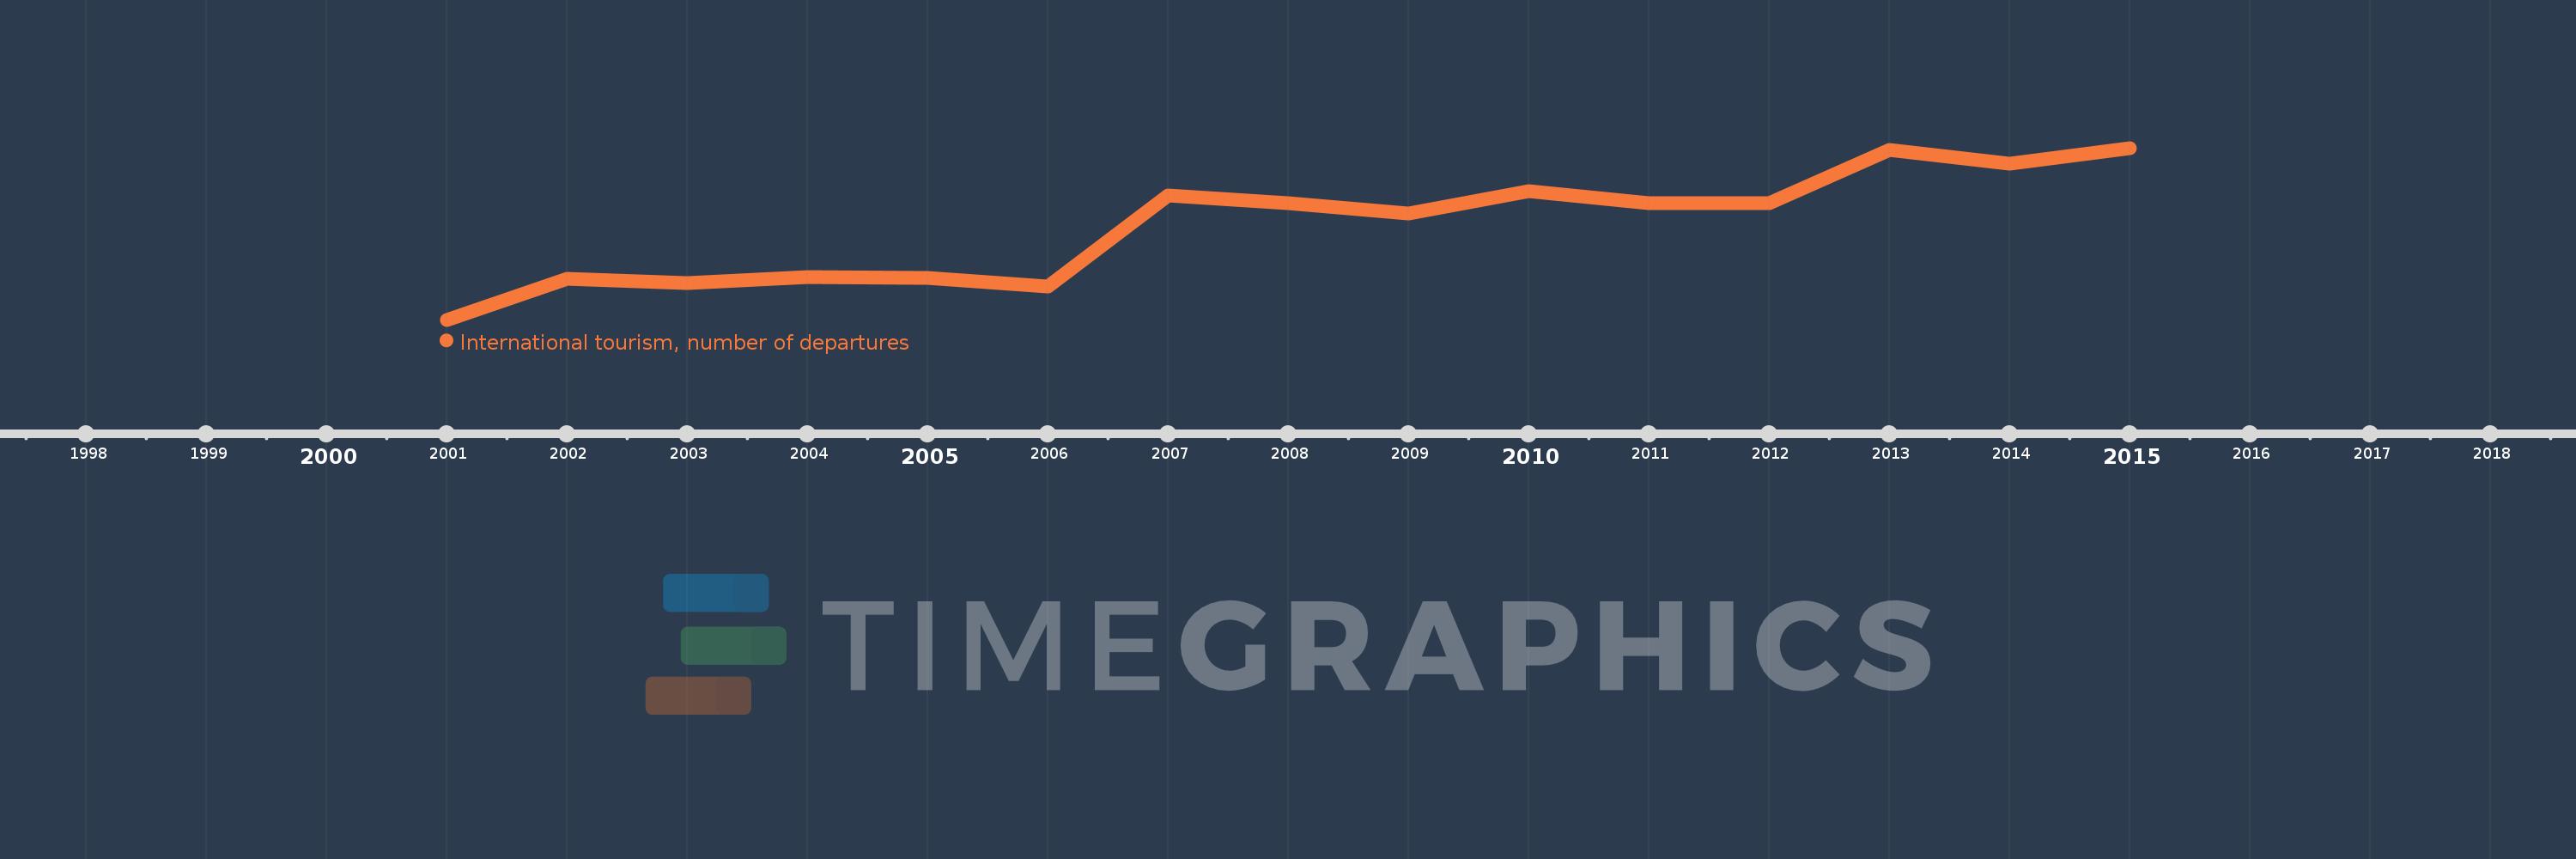
Questa scala temporale mostra un grafico dal 2001 anno al 2015 anno. Austria. I dati fino ad 2000 anno non disponibili. Il numero di osservazioni attuali secondo i date: 15.
La fonte (nome):
Indicatori dello sviluppo mondiale
La fonte (organizzazione):
World Tourism Organization, Yearbook of Tourism Statistics, Compendium of Tourism Statistics and data files.
Categorie:
Private Sector, Trade
sono stati aggiornati
23 apr 2017 anni
Indicatori delle variazioni dei valori per anni
In media:
9.413 Mln
Minima:
7.528 Mln
1 gen 2001 anni
Massimo:
10.994 Mln
1 gen 2015 anni
Alla data di osservazione
Valore
Variazione assoluta
La variazione rispetto al valore precedente
1 gen 2001 anni
7.528 Mln
+7.528 Mln
0.0%
1 gen 2002 anni
8.35 Mln
+822.0 Mille.
10.92%
1 gen 2003 anni
8.266 Mln
-84.0 Mille.
-1.01%
1 gen 2004 anni
8.384 Mln
+118.0 Mille.
1.43%
1 gen 2005 anni
8.371 Mln
-13.0 Mille.
-0.16%
1 gen 2006 anni
8.206 Mln
-165.0 Mille.
-1.97%
1 gen 2007 anni
10.042 Mln
+1.836 Mln
22.37%
1 gen 2008 anni
9.876 Mln
-166.0 Mille.
-1.65%
1 gen 2009 anni
9.677 Mln
-199.0 Mille.
-2.01%
1 gen 2010 anni
10.121 Mln
+444.0 Mille.
4.59%
1 gen 2011 anni
9.882 Mln
-239.0 Mille.
-2.36%
1 gen 2012 anni
9.874 Mln
-8.0 Mille.
-0.08%
1 gen 2013 anni
10.96 Mln
+1.086 Mln
11.0%
1 gen 2014 anni
10.671 Mln
-289.0 Mille.
-2.64%
1 gen 2015 anni
10.994 Mln
+323.0 Mille.
3.03%
Classificazione dei paesi secondo i statistiche attuali per anni