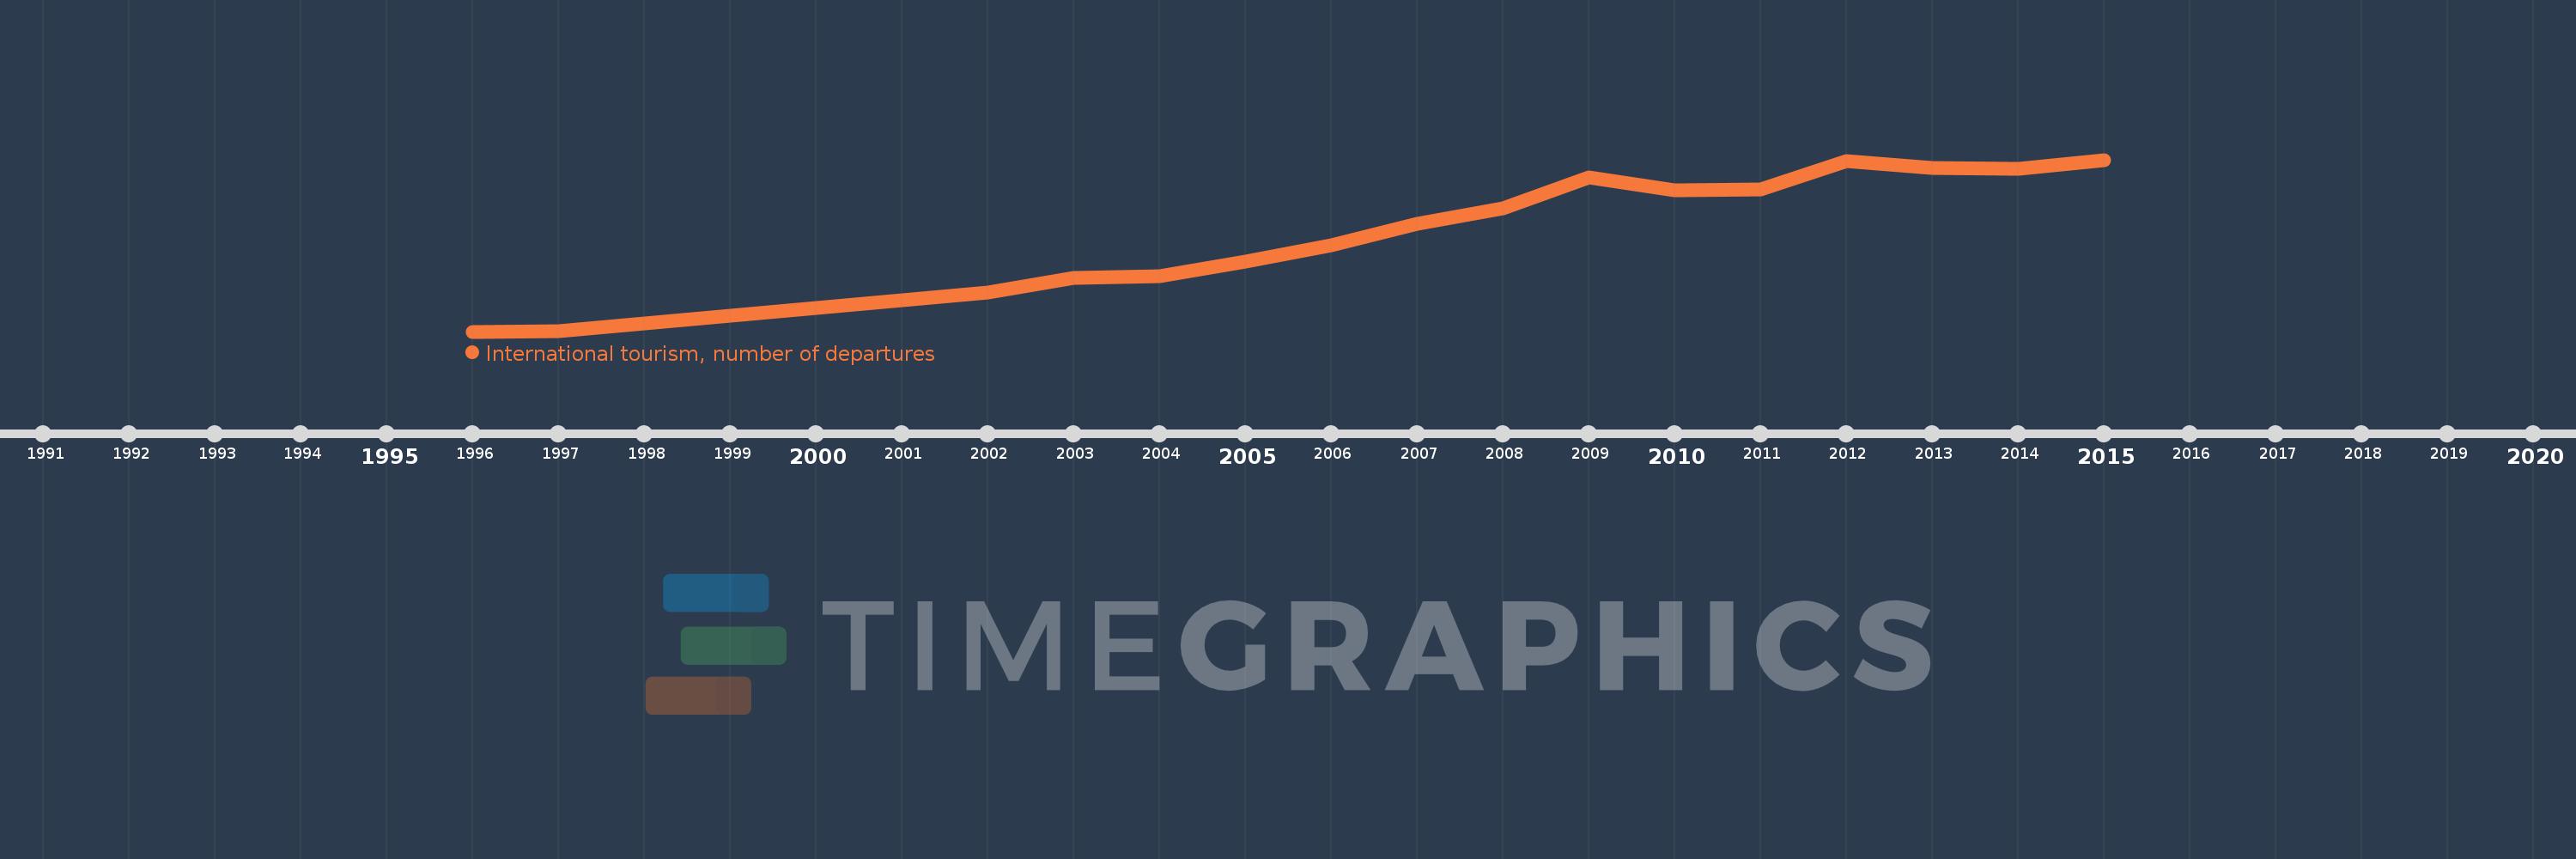
Questa scala temporale mostra un grafico dal 1996 anno al 2015 anno. Albania. I dati fino ad 1995 anno non disponibili. Il numero di osservazioni attuali secondo i date: 16.
La fonte (nome):
Indicatori dello sviluppo mondiale
La fonte (organizzazione):
World Tourism Organization, Yearbook of Tourism Statistics, Compendium of Tourism Statistics and data files.
Categorie:
Private Sector, Trade
sono stati aggiornati
23 apr 2017 anni
Indicatori delle variazioni dei valori per anni
In media:
2.484 Mln
Minima:
12.0 Mille.
1 gen 1996 anni
Massimo:
4.146 Mln
1 gen 2015 anni
Alla data di osservazione
Valore
Variazione assoluta
La variazione rispetto al valore precedente
1 gen 1996 anni
12.0 Mille.
+12.0 Mille.
0.0%
1 gen 1997 anni
16.0 Mille.
+4.0 Mille.
33.33%
1 gen 2002 anni
955.0 Mille.
+939.0 Mille.
5.87 Mille.%
1 gen 2003 anni
1.303 Mln
+348.0 Mille.
36.44%
1 gen 2004 anni
1.35 Mln
+47.0 Mille.
3.61%
1 gen 2005 anni
1.694 Mln
+344.0 Mille.
25.48%
1 gen 2006 anni
2.097 Mln
+403.0 Mille.
23.79%
1 gen 2007 anni
2.616 Mln
+519.0 Mille.
24.75%
1 gen 2008 anni
2.979 Mln
+363.0 Mille.
13.88%
1 gen 2009 anni
3.716 Mln
+737.0 Mille.
24.74%
1 gen 2010 anni
3.404 Mln
-312.0 Mille.
-8.4%
1 gen 2011 anni
3.443 Mln
+39.0 Mille.
1.15%
1 gen 2012 anni
4.12 Mln
+677.0 Mille.
19.66%
1 gen 2013 anni
3.959 Mln
-161.0 Mille.
-3.91%
1 gen 2014 anni
3.928 Mln
-31.0 Mille.
-0.78%
1 gen 2015 anni
4.146 Mln
+218.0 Mille.
5.55%
Classificazione dei paesi secondo i statistiche attuali per anni