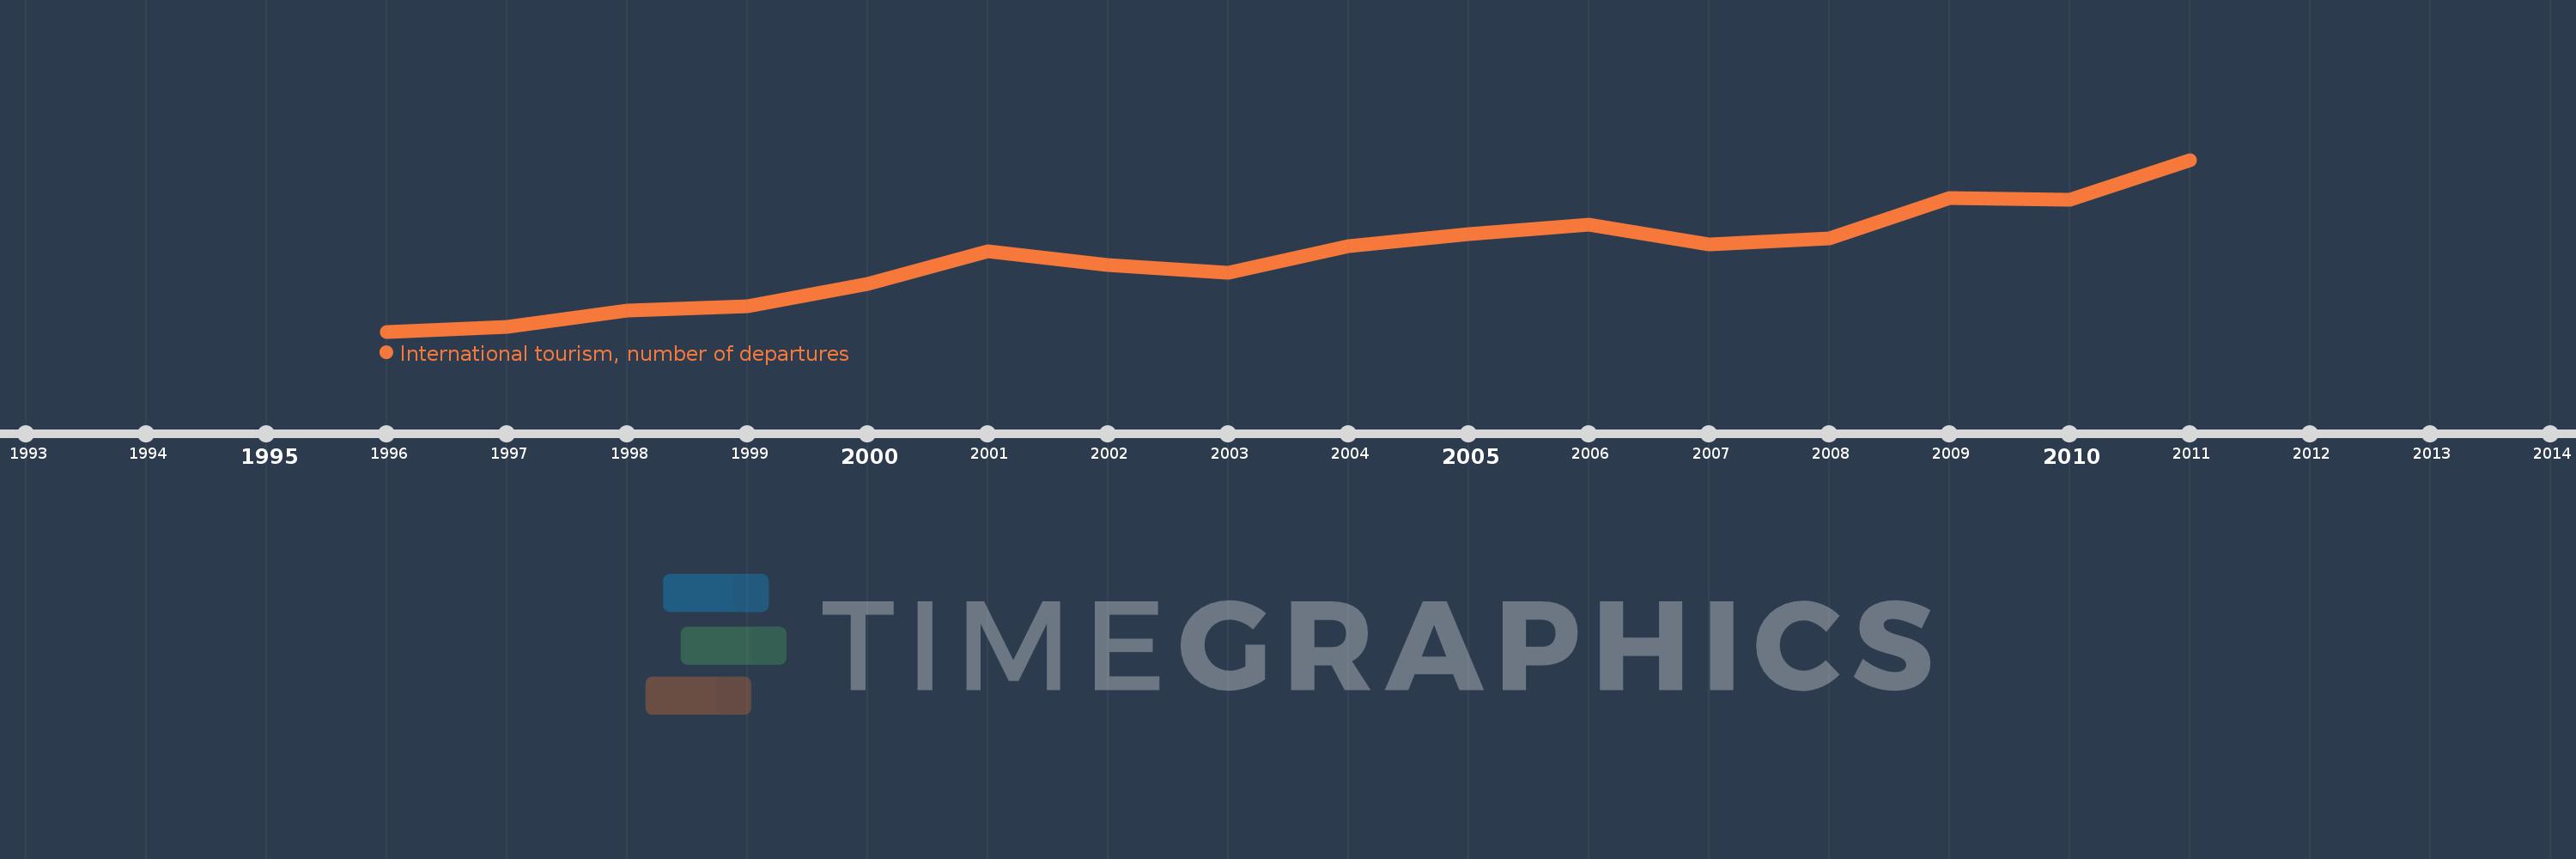
Questa scala temporale mostra un grafico dal 1996 anno al 2011 anno. Syrian Arab Republic. I dati fino ad 1995 anno non disponibili. Il numero di osservazioni attuali secondo i date: 16.
La fonte (nome):
Indicatori dello sviluppo mondiale
La fonte (organizzazione):
World Tourism Organization, Yearbook of Tourism Statistics, Compendium of Tourism Statistics and data files.
Categorie:
Private Sector, Trade
sono stati aggiornati
23 apr 2017 anni
Indicatori delle variazioni dei valori per anni
In media:
3.738 Mln
Minima:
1.746 Mln
1 gen 1996 anni
Massimo:
6.259 Mln
1 gen 2011 anni
Alla data di osservazione
Valore
Variazione assoluta
La variazione rispetto al valore precedente
1 gen 1996 anni
1.746 Mln
+1.746 Mln
0.0%
1 gen 1997 anni
1.871 Mln
+125.0 Mille.
7.16%
1 gen 1998 anni
2.299 Mln
+428.0 Mille.
22.88%
1 gen 1999 anni
2.411 Mln
+112.0 Mille.
4.87%
1 gen 2000 anni
2.994 Mln
+583.0 Mille.
24.18%
1 gen 2001 anni
3.863 Mln
+869.0 Mille.
29.02%
1 gen 2002 anni
3.492 Mln
-371.0 Mille.
-9.6%
1 gen 2003 anni
3.299 Mln
-193.0 Mille.
-5.53%
1 gen 2004 anni
3.997 Mln
+698.0 Mille.
21.16%
1 gen 2005 anni
4.309 Mln
+312.0 Mille.
7.81%
1 gen 2006 anni
4.564 Mln
+255.0 Mille.
5.92%
1 gen 2007 anni
4.042 Mln
-522.0 Mille.
-11.44%
1 gen 2008 anni
4.196 Mln
+154.0 Mille.
3.81%
1 gen 2009 anni
5.253 Mln
+1.057 Mln
25.19%
1 gen 2010 anni
5.215 Mln
-38.0 Mille.
-0.72%
1 gen 2011 anni
6.259 Mln
+1.044 Mln
20.02%
Classificazione dei paesi secondo i statistiche attuali per anni