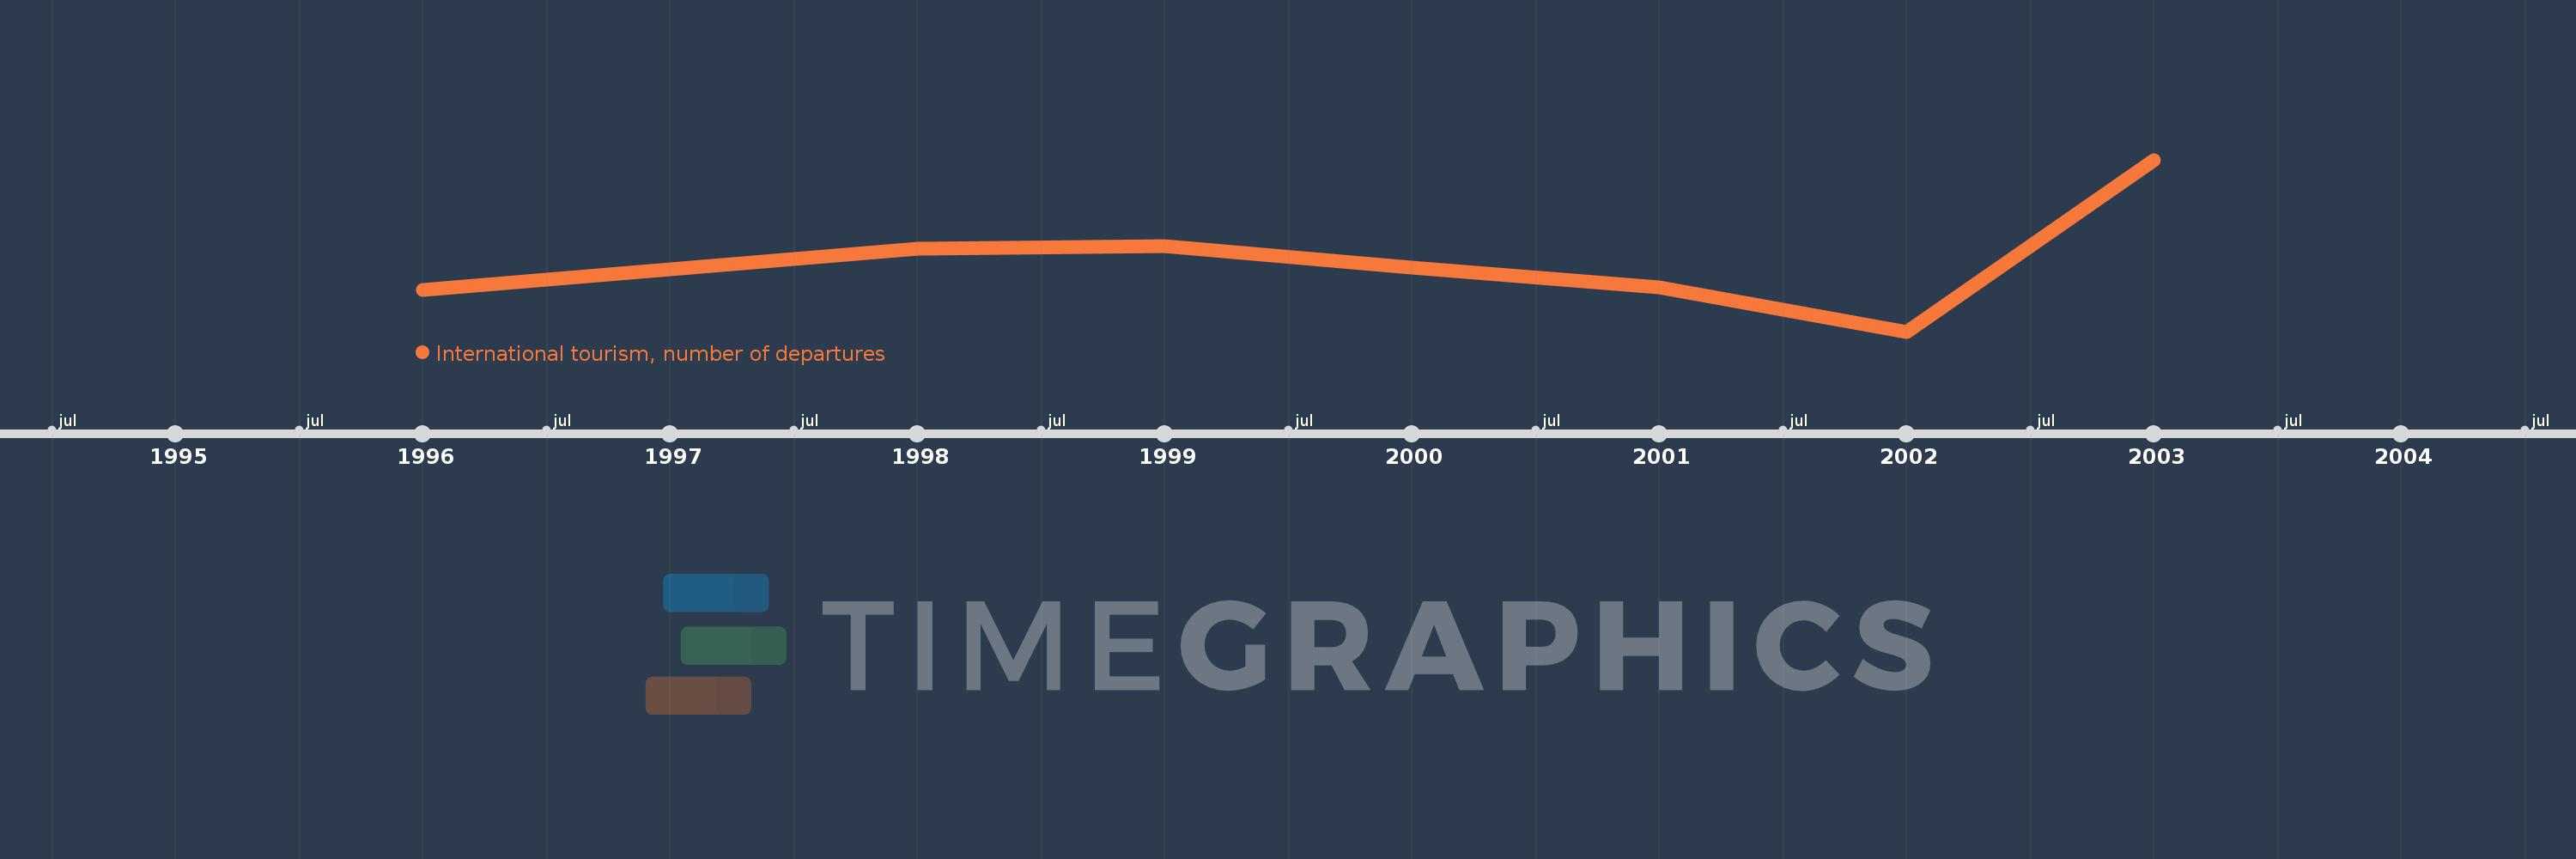
Questa scala temporale mostra un grafico dal 1996 anno al 2003 anno. Papua New Guinea. I dati fino ad 1995 anno non disponibili. Il numero di osservazioni attuali secondo i date: 7.
La fonte (nome):
Indicatori dello sviluppo mondiale
La fonte (organizzazione):
World Tourism Organization, Yearbook of Tourism Statistics, Compendium of Tourism Statistics and data files.
Categorie:
Private Sector, Trade
sono stati aggiornati
23 apr 2017 anni
Indicatori delle variazioni dei valori per anni
In media:
60.0 Mille.
Minima:
38.0 Mille.
1 gen 2002 anni
Massimo:
92.0 Mille.
1 gen 2003 anni
Alla data di osservazione
Valore
Variazione assoluta
La variazione rispetto al valore precedente
1 gen 1996 anni
51.0 Mille.
+51.0 Mille.
0.0%
1 gen 1998 anni
64.0 Mille.
+13.0 Mille.
25.49%
1 gen 1999 anni
65.0 Mille.
+1000.0
1.56%
1 gen 2000 anni
58.0 Mille.
-7.0 Mille.
-10.77%
1 gen 2001 anni
52.0 Mille.
-6.0 Mille.
-10.34%
1 gen 2002 anni
38.0 Mille.
-14.0 Mille.
-26.92%
1 gen 2003 anni
92.0 Mille.
+54.0 Mille.
142.11%
Classificazione dei paesi secondo i statistiche attuali per anni