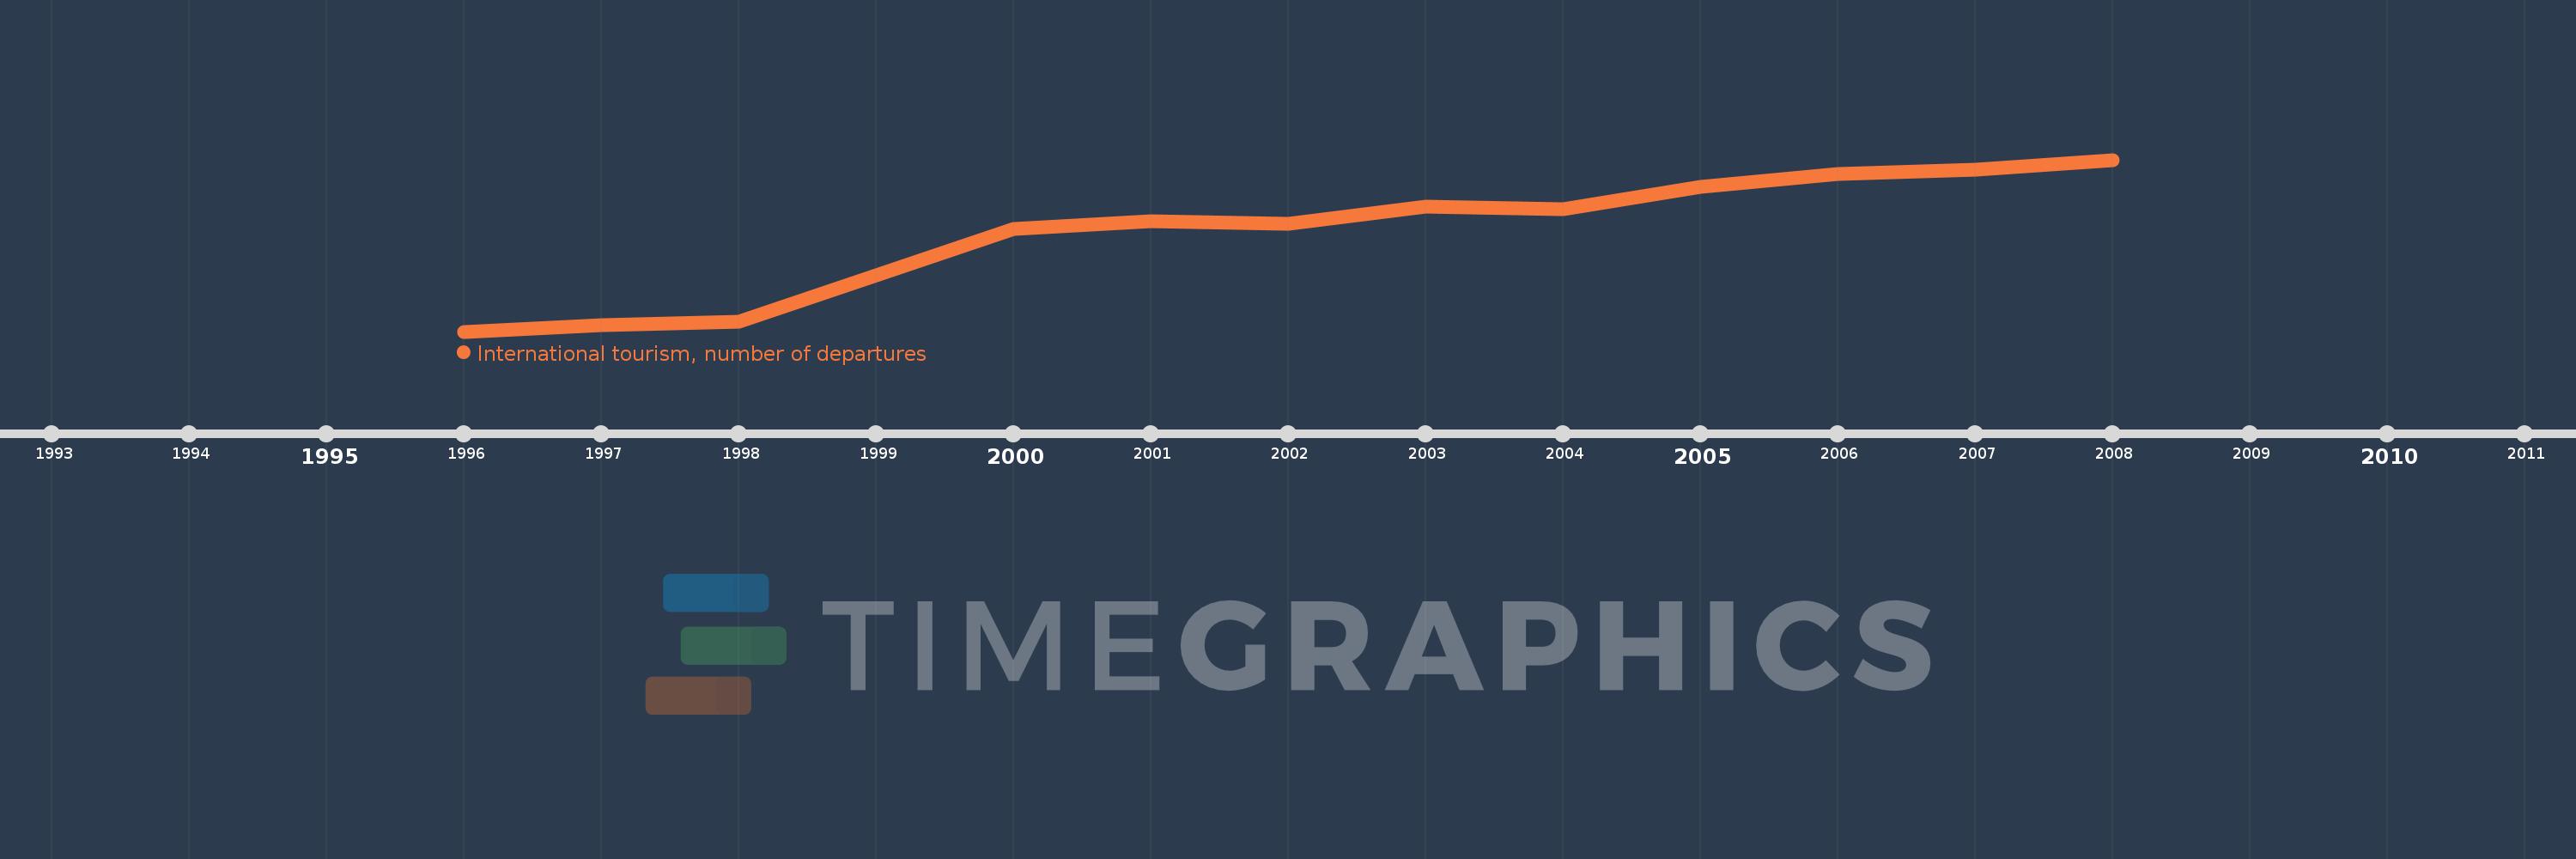
Questa scala temporale mostra un grafico dal 1996 anno al 2008 anno. Norway. I dati fino ad 1995 anno non disponibili. Il numero di osservazioni attuali secondo i date: 12.
La fonte (nome):
Indicatori dello sviluppo mondiale
La fonte (organizzazione):
World Tourism Organization, Yearbook of Tourism Statistics, Compendium of Tourism Statistics and data files.
Categorie:
Private Sector, Trade
sono stati aggiornati
23 apr 2017 anni
Indicatori delle variazioni dei valori per anni
In media:
2.252 Mln
Minima:
590.0 Mille.
1 gen 1996 anni
Massimo:
3.395 Mln
1 gen 2008 anni
Alla data di osservazione
Valore
Variazione assoluta
La variazione rispetto al valore precedente
1 gen 1996 anni
590.0 Mille.
+590.0 Mille.
0.0%
1 gen 1997 anni
692.0 Mille.
+102.0 Mille.
17.29%
1 gen 1998 anni
753.0 Mille.
+61.0 Mille.
8.82%
1 gen 2000 anni
2.271 Mln
+1.518 Mln
201.59%
1 gen 2001 anni
2.394 Mln
+123.0 Mille.
5.42%
1 gen 2002 anni
2.348 Mln
-46.0 Mille.
-1.92%
1 gen 2003 anni
2.629 Mln
+281.0 Mille.
11.97%
1 gen 2004 anni
2.588 Mln
-41.0 Mille.
-1.56%
1 gen 2005 anni
2.96 Mln
+372.0 Mille.
14.37%
1 gen 2006 anni
3.166 Mln
+206.0 Mille.
6.96%
1 gen 2007 anni
3.236 Mln
+70.0 Mille.
2.21%
1 gen 2008 anni
3.395 Mln
+159.0 Mille.
4.91%
Classificazione dei paesi secondo i statistiche attuali per anni