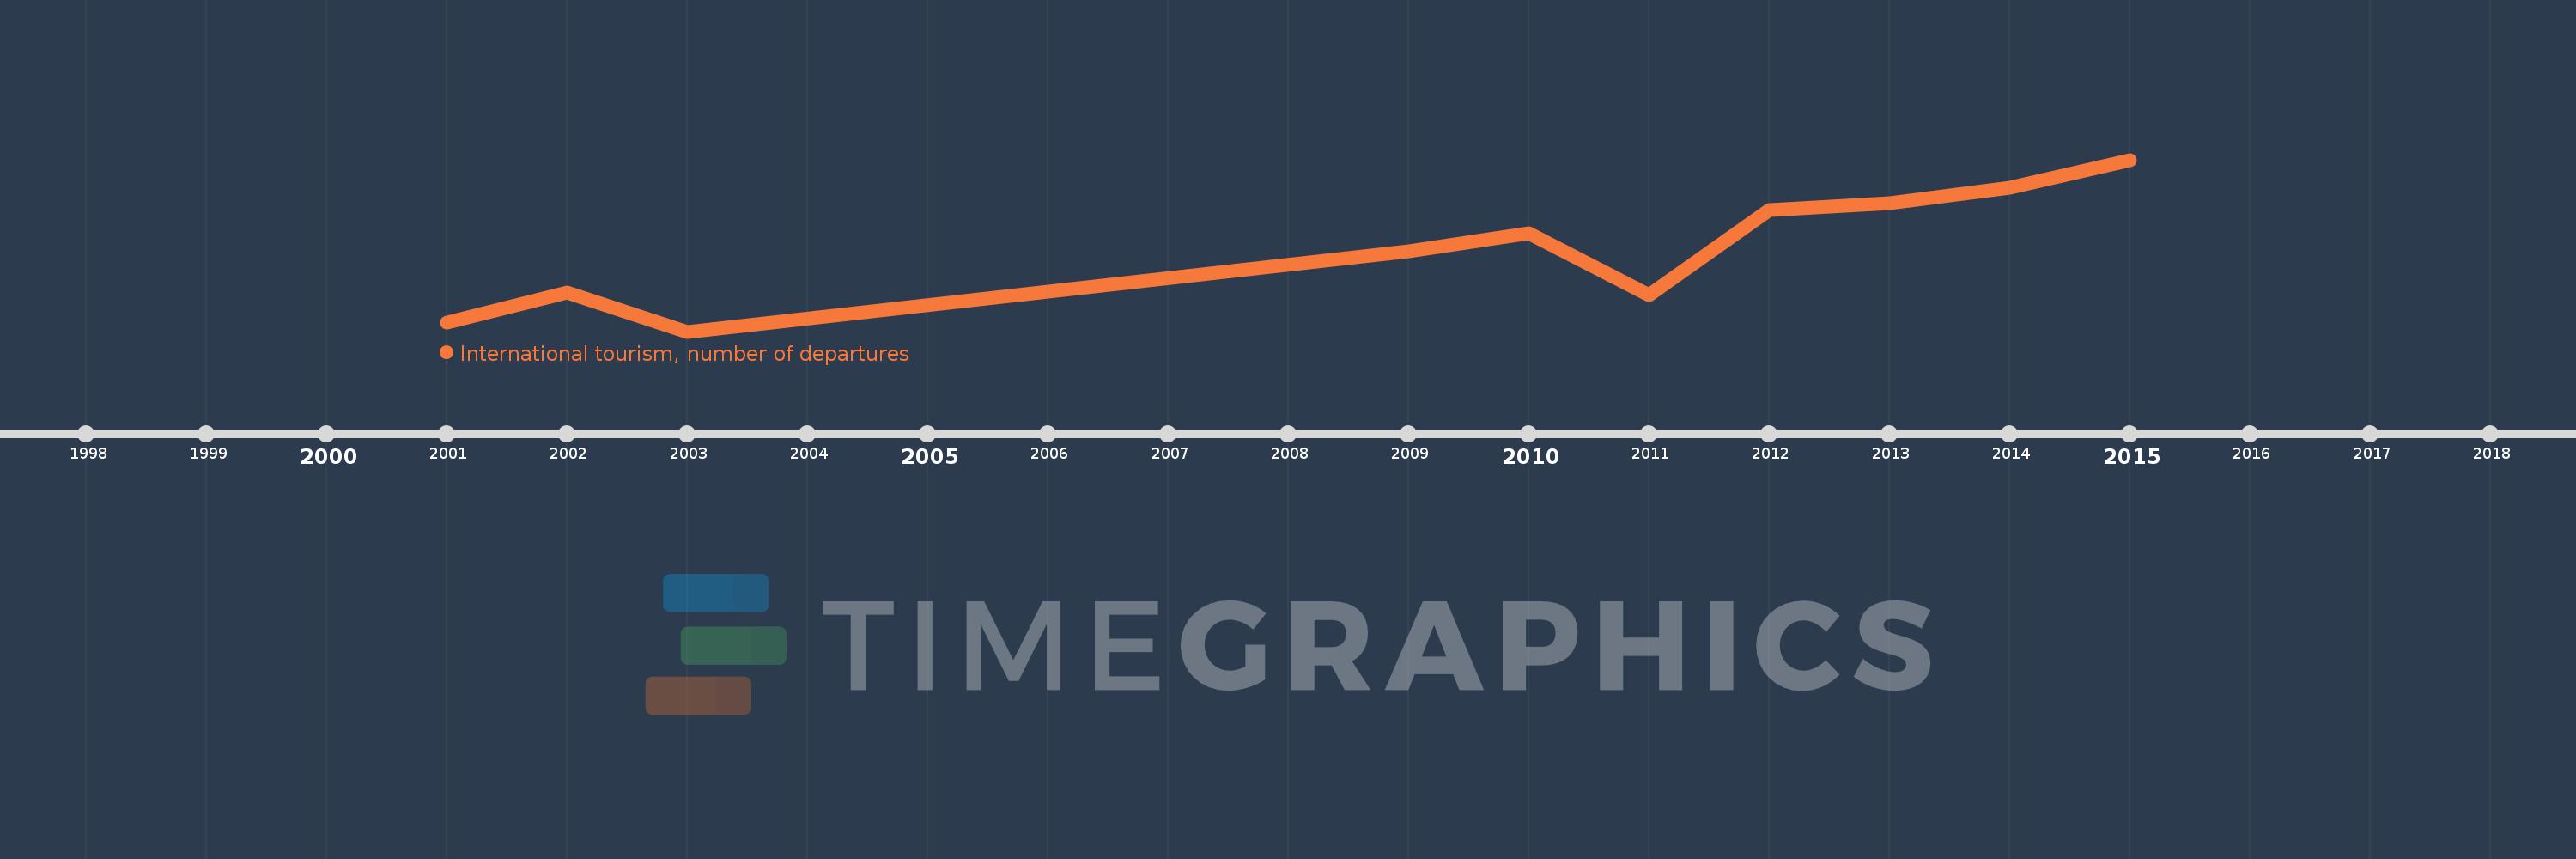
Questa scala temporale mostra un grafico dal 2001 anno al 2015 anno. Chad. I dati fino ad 2000 anno non disponibili. Il numero di osservazioni attuali secondo i date: 10.
La fonte (nome):
Indicatori dello sviluppo mondiale
La fonte (organizzazione):
World Tourism Organization, Yearbook of Tourism Statistics, Compendium of Tourism Statistics and data files.
Categorie:
Private Sector, Trade
sono stati aggiornati
23 apr 2017 anni
Indicatori delle variazioni dei valori per anni
In media:
59.2 Mille.
Minima:
23.0 Mille.
1 gen 2003 anni
Massimo:
98.0 Mille.
1 gen 2015 anni
Alla data di osservazione
Valore
Variazione assoluta
La variazione rispetto al valore precedente
1 gen 2001 anni
27.0 Mille.
+27.0 Mille.
0.0%
1 gen 2002 anni
40.0 Mille.
+13.0 Mille.
48.15%
1 gen 2003 anni
23.0 Mille.
-17.0 Mille.
-42.5%
1 gen 2009 anni
58.0 Mille.
+35.0 Mille.
152.17%
1 gen 2010 anni
66.0 Mille.
+8.0 Mille.
13.79%
1 gen 2011 anni
39.0 Mille.
-27.0 Mille.
-40.91%
1 gen 2012 anni
76.0 Mille.
+37.0 Mille.
94.87%
1 gen 2013 anni
79.0 Mille.
+3.0 Mille.
3.95%
1 gen 2014 anni
86.0 Mille.
+7.0 Mille.
8.86%
1 gen 2015 anni
98.0 Mille.
+12.0 Mille.
13.95%
Classificazione dei paesi secondo i statistiche attuali per anni