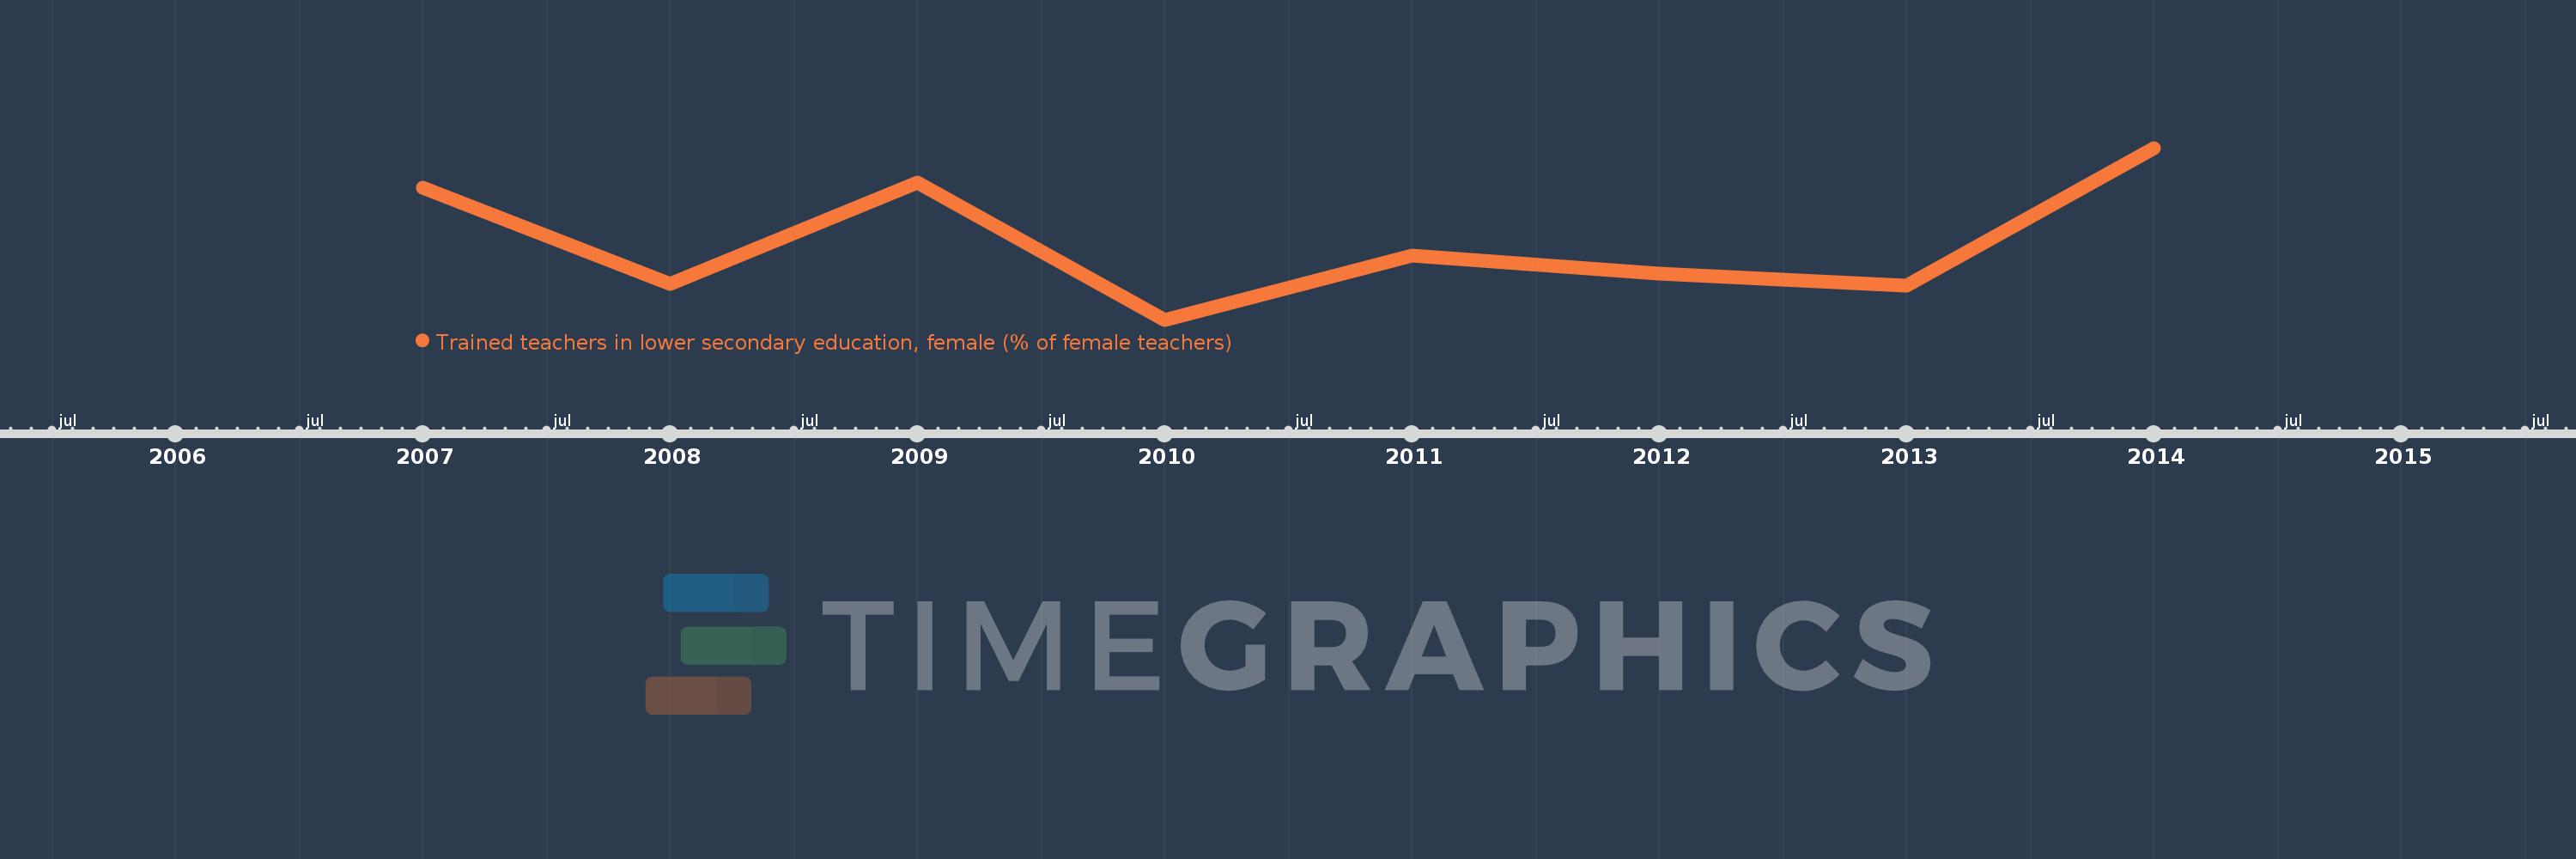
Questa scala temporale mostra un grafico dal 2007 anno al 2014 anno. Sub-Saharan Africa (excluding high income). I dati fino ad 2006 anno non disponibili. Il numero di osservazioni attuali secondo i date: 8.
La fonte (nome):
Indicatori dello sviluppo mondiale
La fonte (organizzazione):
United Nations Educational, Scientific, and Cultural Organization (UNESCO) Institute for Statistics.
Categorie:
Education
sono stati aggiornati
23 apr 2017 anni
Indicatori delle variazioni dei valori per anni
In media:
72.689
Minima:
64.567
1 gen 2010 anni
Massimo:
82.574
1 gen 2014 anni
Alla data di osservazione
Valore
Variazione assoluta
La variazione rispetto al valore precedente
1 gen 2007 anni
78.361
+78.361
0.0%
1 gen 2008 anni
68.315
-10.046
-12.82%
1 gen 2009 anni
78.916
+10.601
15.52%
1 gen 2010 anni
64.567
-14.349
-18.18%
1 gen 2011 anni
71.274
+6.707
10.39%
1 gen 2012 anni
69.382
-1.892
-2.65%
1 gen 2013 anni
68.124
-1.257
-1.81%
1 gen 2014 anni
82.574
+14.449
21.21%
Classificazione dei paesi secondo i statistiche attuali per anni