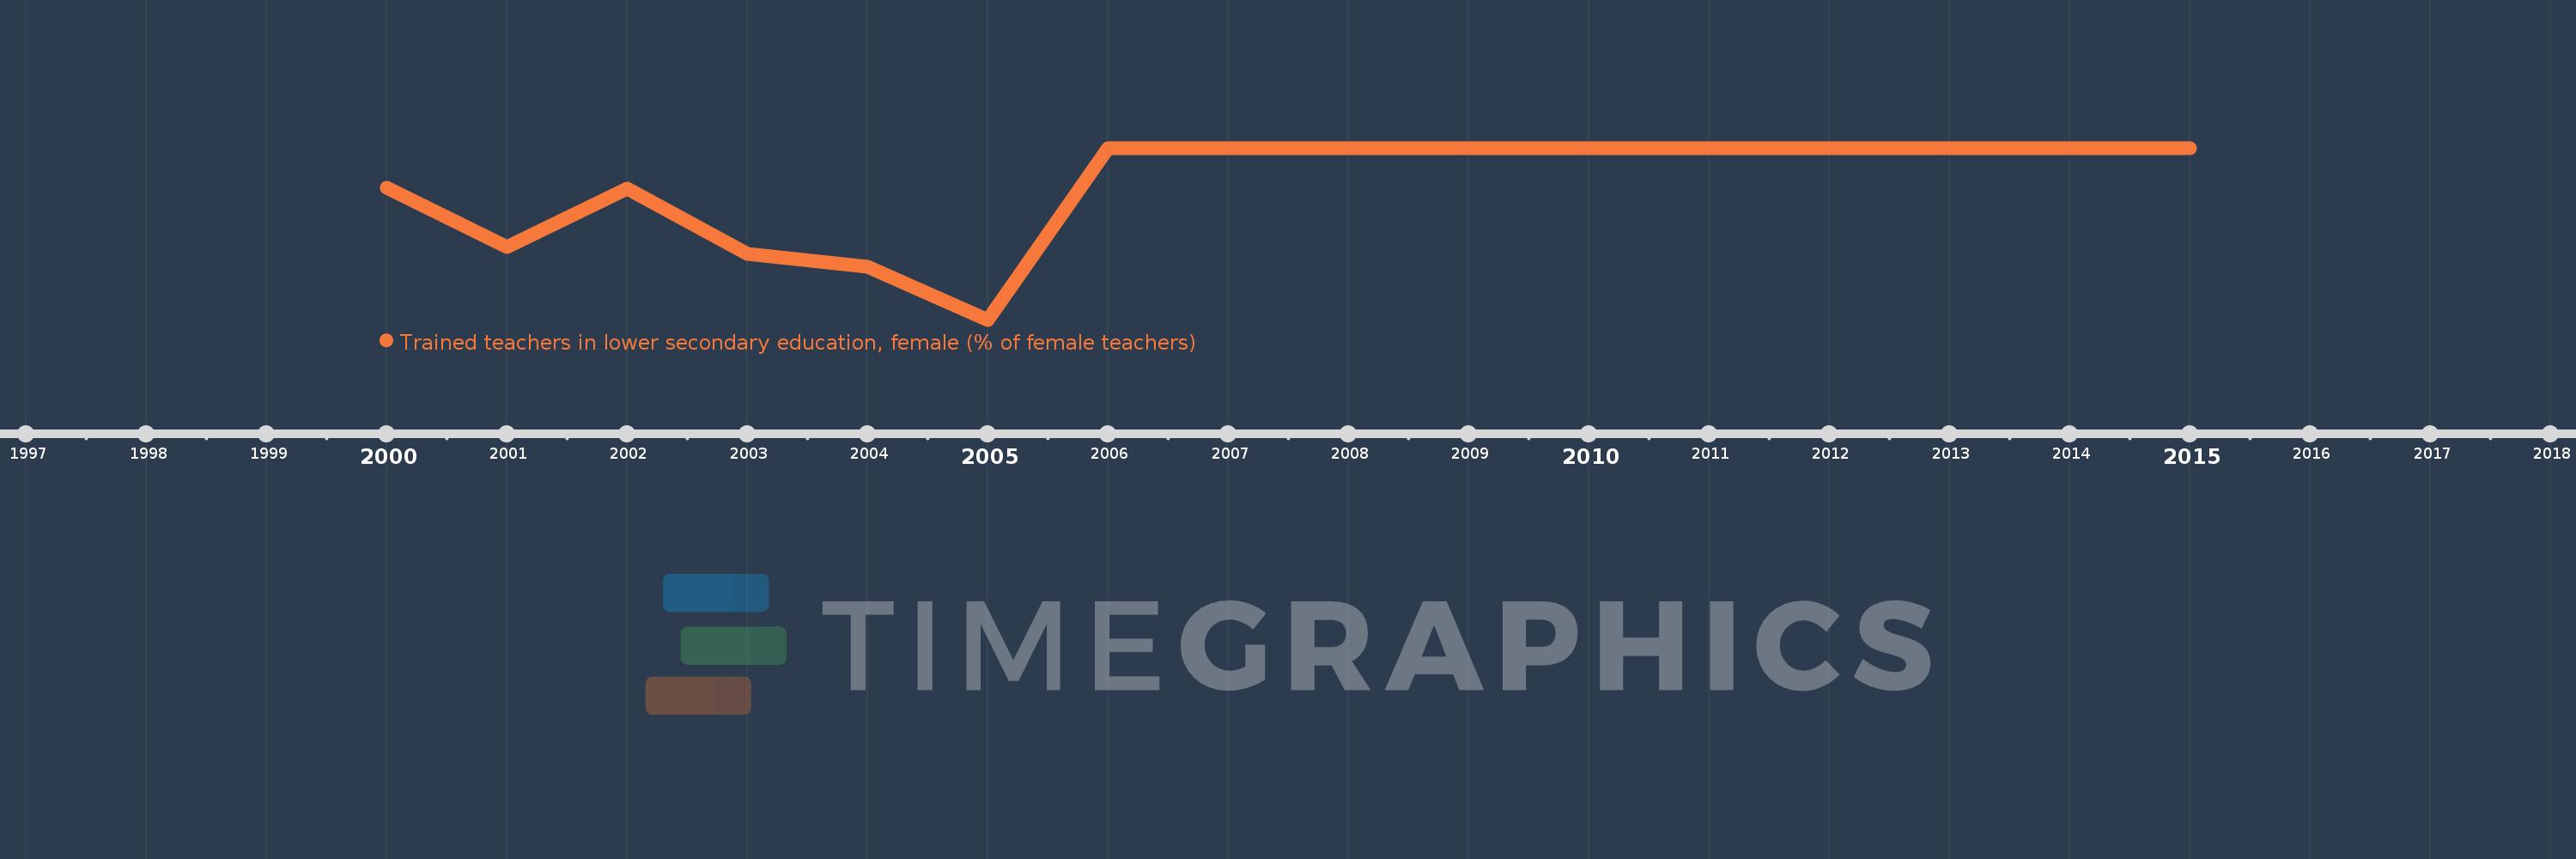
Questa scala temporale mostra un grafico dal 2000 anno al 2015 anno. Cuba. I dati fino ad 1999 anno non disponibili. Il numero di osservazioni attuali secondo i date: 16.
La fonte (nome):
Indicatori dello sviluppo mondiale
La fonte (organizzazione):
United Nations Educational, Scientific, and Cultural Organization (UNESCO) Institute for Statistics.
Categorie:
Education
sono stati aggiornati
23 apr 2017 anni
Indicatori delle variazioni dei valori per anni
In media:
95.162
Minima:
76.905
1 gen 2005 anni
Massimo:
100.0
1 gen 2006 anni
Alla data di osservazione
Valore
Variazione assoluta
La variazione rispetto al valore precedente
1 gen 2000 anni
94.606
+94.606
0.0%
1 gen 2001 anni
86.684
-7.922
-8.37%
1 gen 2002 anni
94.54
+7.856
9.06%
1 gen 2003 anni
85.813
-8.727
-9.23%
1 gen 2004 anni
84.043
-1.77
-2.06%
1 gen 2005 anni
76.905
-7.138
-8.49%
1 gen 2006 anni
100.0
+23.095
30.03%
1 gen 2007 anni
100.0
0.0
0.0%
1 gen 2008 anni
100.0
0.0
0.0%
1 gen 2009 anni
100.0
0.0
0.0%
1 gen 2010 anni
100.0
0.0
0.0%
1 gen 2011 anni
100.0
0.0
0.0%
1 gen 2012 anni
100.0
0.0
0.0%
1 gen 2013 anni
100.0
0.0
0.0%
1 gen 2014 anni
100.0
0.0
0.0%
1 gen 2015 anni
100.0
0.0
0.0%
Classificazione dei paesi secondo i statistiche attuali per anni