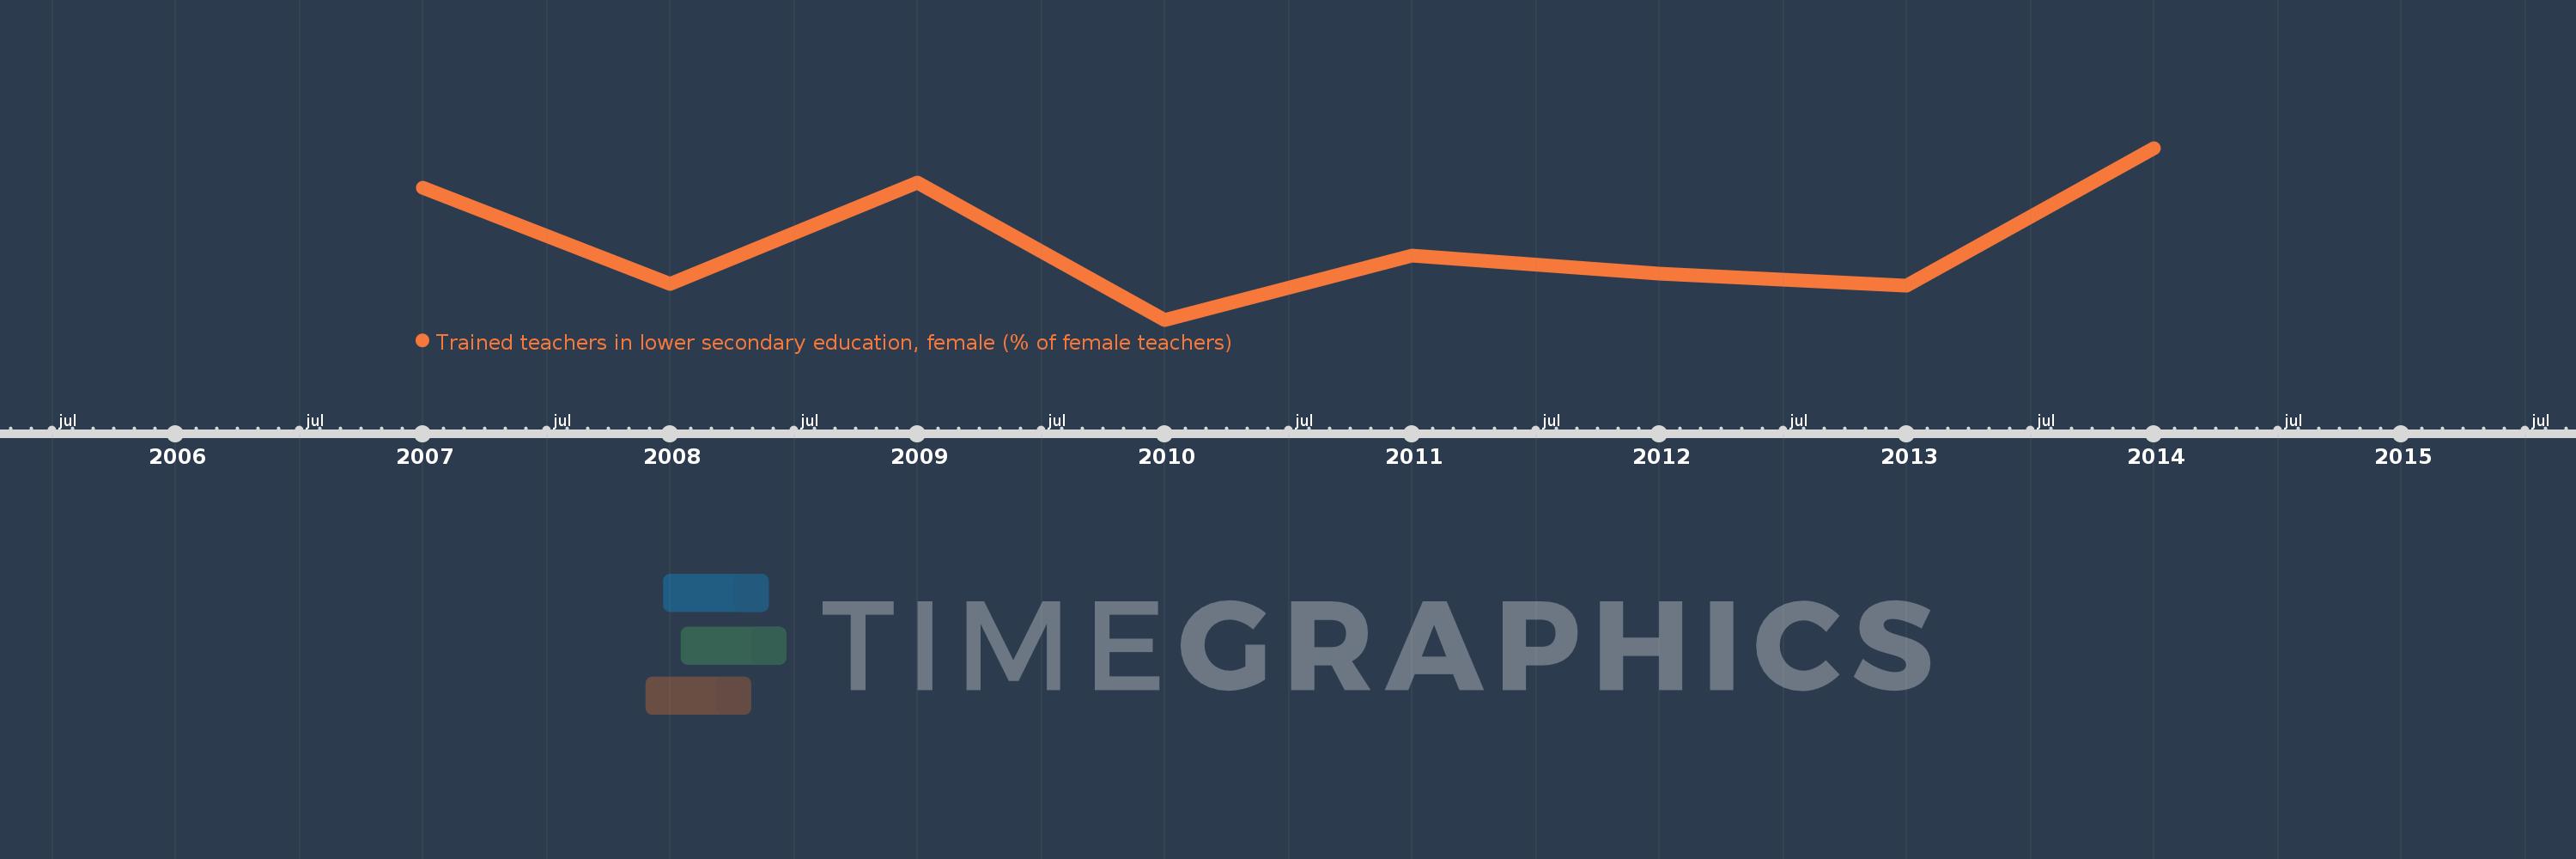
Questa scala temporale mostra un grafico dal 2007 anno al 2014 anno. Sub-Saharan Africa . I dati fino ad 2006 anno non disponibili. Il numero di osservazioni attuali secondo i date: 8.
La fonte (nome):
Indicatori dello sviluppo mondiale
La fonte (organizzazione):
United Nations Educational, Scientific, and Cultural Organization (UNESCO) Institute for Statistics.
Categorie:
Education
sono stati aggiornati
23 apr 2017 anni
Indicatori delle variazioni dei valori per anni
In media:
72.683
Minima:
64.565
1 gen 2010 anni
Massimo:
82.561
1 gen 2014 anni
Alla data di osservazione
Valore
Variazione assoluta
La variazione rispetto al valore precedente
1 gen 2007 anni
78.354
+78.354
0.0%
1 gen 2008 anni
68.313
-10.041
-12.81%
1 gen 2009 anni
78.908
+10.595
15.51%
1 gen 2010 anni
64.565
-14.343
-18.18%
1 gen 2011 anni
71.268
+6.703
10.38%
1 gen 2012 anni
69.378
-1.89
-2.65%
1 gen 2013 anni
68.12
-1.258
-1.81%
1 gen 2014 anni
82.561
+14.441
21.2%
Classificazione dei paesi secondo i statistiche attuali per anni