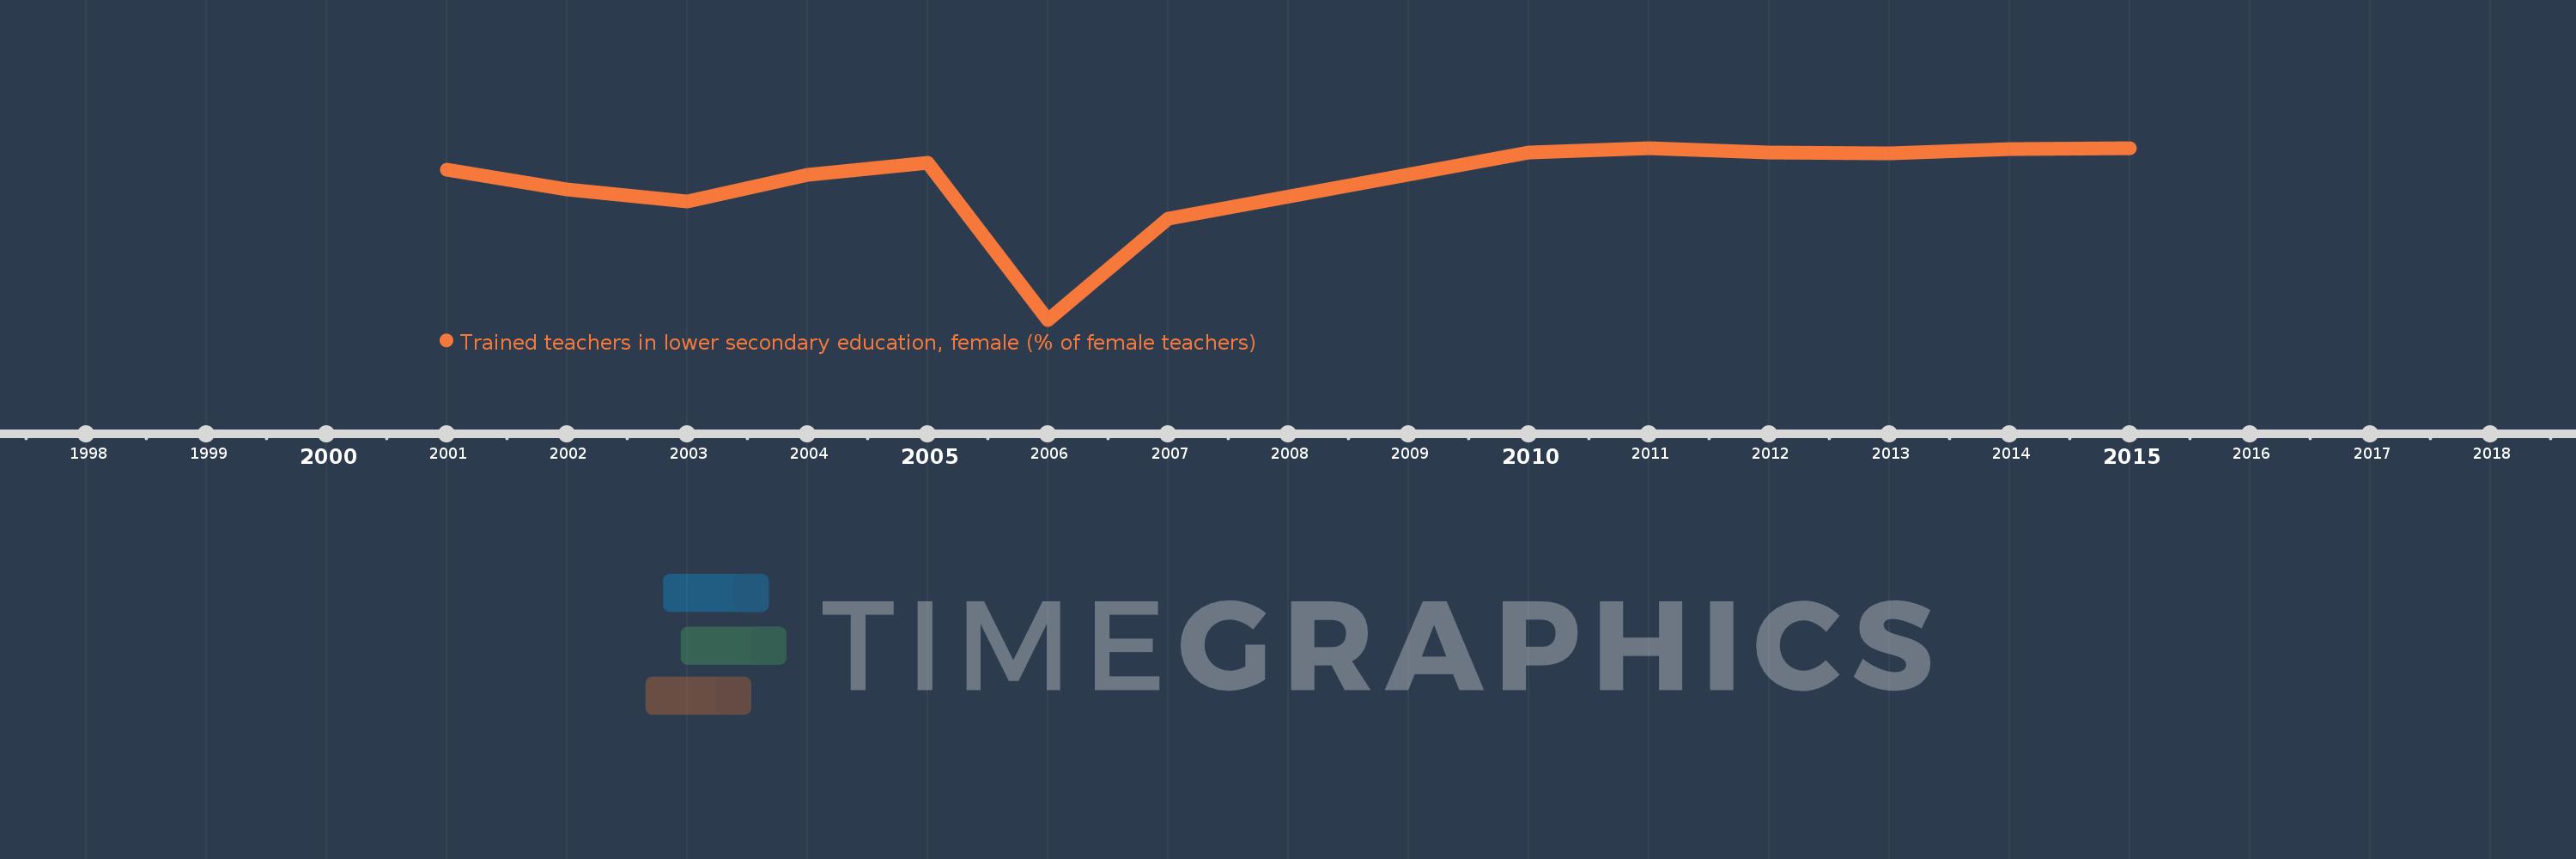
Questa scala temporale mostra un grafico dal 2001 anno al 2015 anno. Lao PDR. I dati fino ad 2000 anno non disponibili. Il numero di osservazioni attuali secondo i date: 13.
La fonte (nome):
Indicatori dello sviluppo mondiale
La fonte (organizzazione):
United Nations Educational, Scientific, and Cultural Organization (UNESCO) Institute for Statistics.
Categorie:
Education
sono stati aggiornati
23 apr 2017 anni
Indicatori delle variazioni dei valori per anni
In media:
98.351
Minima:
92.493
1 gen 2006 anni
Massimo:
99.692
1 gen 2015 anni
Alla data di osservazione
Valore
Variazione assoluta
La variazione rispetto al valore precedente
1 gen 2001 anni
98.79
+98.79
0.0%
1 gen 2002 anni
97.953
-0.837
-0.85%
1 gen 2003 anni
97.453
-0.5
-0.51%
1 gen 2004 anni
98.559
+1.105
1.13%
1 gen 2005 anni
99.08
+0.521
0.53%
1 gen 2006 anni
92.493
-6.587
-6.65%
1 gen 2007 anni
96.714
+4.221
4.56%
1 gen 2010 anni
99.516
+2.802
2.9%
1 gen 2011 anni
99.683
+0.166
0.17%
1 gen 2012 anni
99.509
-0.174
-0.17%
1 gen 2013 anni
99.463
-0.045
-0.05%
1 gen 2014 anni
99.658
+0.195
0.2%
1 gen 2015 anni
99.692
+0.034
0.03%
Classificazione dei paesi secondo i statistiche attuali per anni