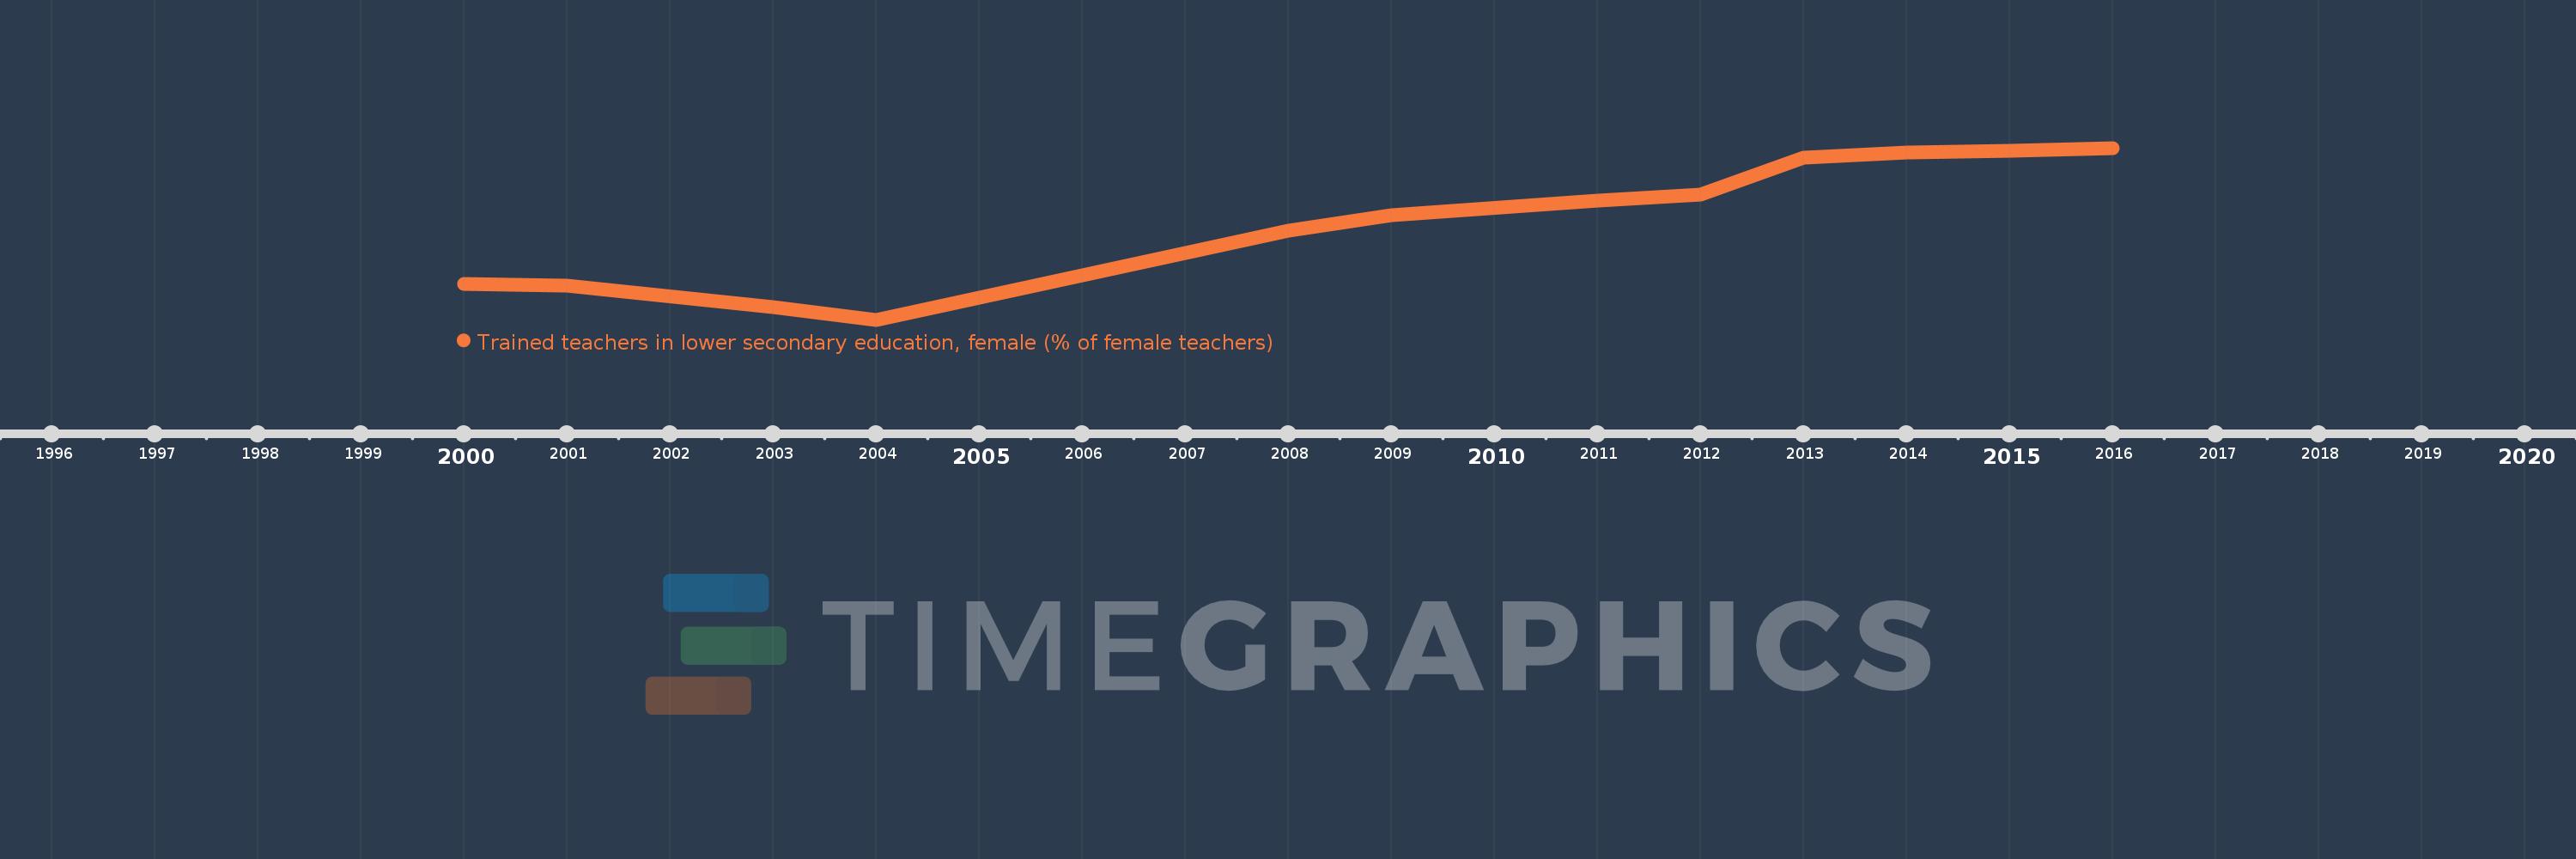
Questa scala temporale mostra un grafico dal 2000 anno al 2016 anno. Nepal. I dati fino ad 1999 anno non disponibili. Il numero di osservazioni attuali secondo i date: 12.
La fonte (nome):
Indicatori dello sviluppo mondiale
La fonte (organizzazione):
United Nations Educational, Scientific, and Cultural Organization (UNESCO) Institute for Statistics.
Categorie:
Education
sono stati aggiornati
23 apr 2017 anni
Indicatori delle variazioni dei valori per anni
In media:
55.194
Minima:
21.815
1 gen 2004 anni
Massimo:
79.583
1 gen 2016 anni
Alla data di osservazione
Valore
Variazione assoluta
La variazione rispetto al valore precedente
1 gen 2000 anni
33.814
+33.814
0.0%
1 gen 2001 anni
33.404
-0.41
-1.21%
1 gen 2003 anni
26.176
-7.227
-21.64%
1 gen 2004 anni
21.815
-4.362
-16.66%
1 gen 2008 anni
51.708
+29.893
137.03%
1 gen 2009 anni
57.063
+5.355
10.36%
1 gen 2011 anni
61.813
+4.75
8.32%
1 gen 2012 anni
63.856
+2.043
3.31%
1 gen 2013 anni
76.231
+12.375
19.38%
1 gen 2014 anni
78.152
+1.92
2.52%
1 gen 2015 anni
78.716
+0.564
0.72%
1 gen 2016 anni
79.583
+0.867
1.1%
Classificazione dei paesi secondo i statistiche attuali per anni