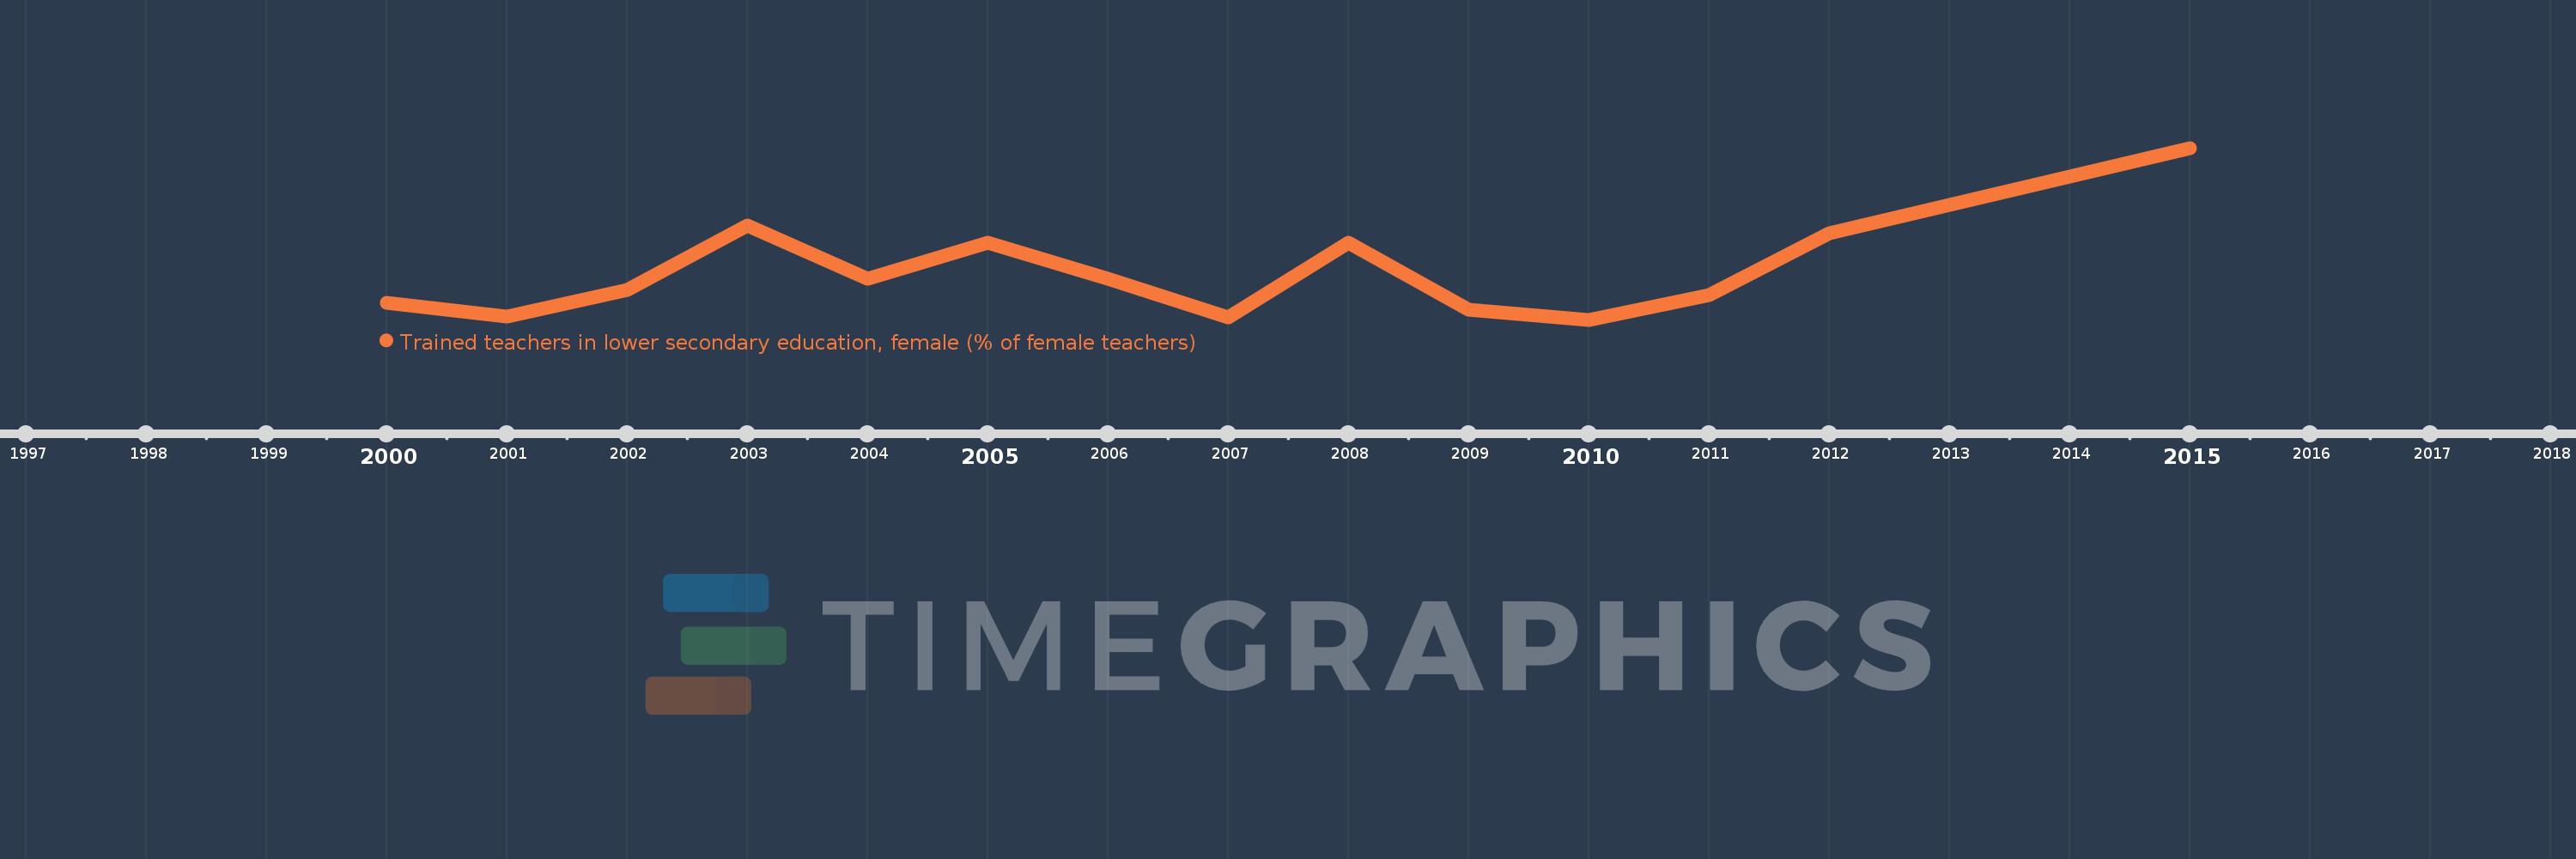
Questa scala temporale mostra un grafico dal 2000 anno al 2015 anno. Dominica. I dati fino ad 1999 anno non disponibili. Il numero di osservazioni attuali secondo i date: 14.
La fonte (nome):
Indicatori dello sviluppo mondiale
La fonte (organizzazione):
United Nations Educational, Scientific, and Cultural Organization (UNESCO) Institute for Statistics.
Categorie:
Education
sono stati aggiornati
23 apr 2017 anni
Indicatori delle variazioni dei valori per anni
In media:
35.34
Minima:
30.542
1 gen 2010 anni
Massimo:
47.619
1 gen 2015 anni
Alla data di osservazione
Valore
Variazione assoluta
La variazione rispetto al valore precedente
1 gen 2000 anni
32.184
+32.184
0.0%
1 gen 2001 anni
30.857
-1.327
-4.12%
1 gen 2002 anni
33.52
+2.662
8.63%
1 gen 2003 anni
39.904
+6.384
19.05%
1 gen 2004 anni
34.595
-5.309
-13.31%
1 gen 2005 anni
38.235
+3.641
10.52%
1 gen 2006 anni
34.653
-3.582
-9.37%
1 gen 2007 anni
30.769
-3.884
-11.21%
1 gen 2008 anni
38.235
+7.466
24.26%
1 gen 2009 anni
31.527
-6.708
-17.54%
1 gen 2010 anni
30.542
-0.985
-3.12%
1 gen 2011 anni
33.01
+2.468
8.08%
1 gen 2012 anni
39.109
+6.099
18.48%
1 gen 2015 anni
47.619
+8.51
21.76%
Classificazione dei paesi secondo i statistiche attuali per anni