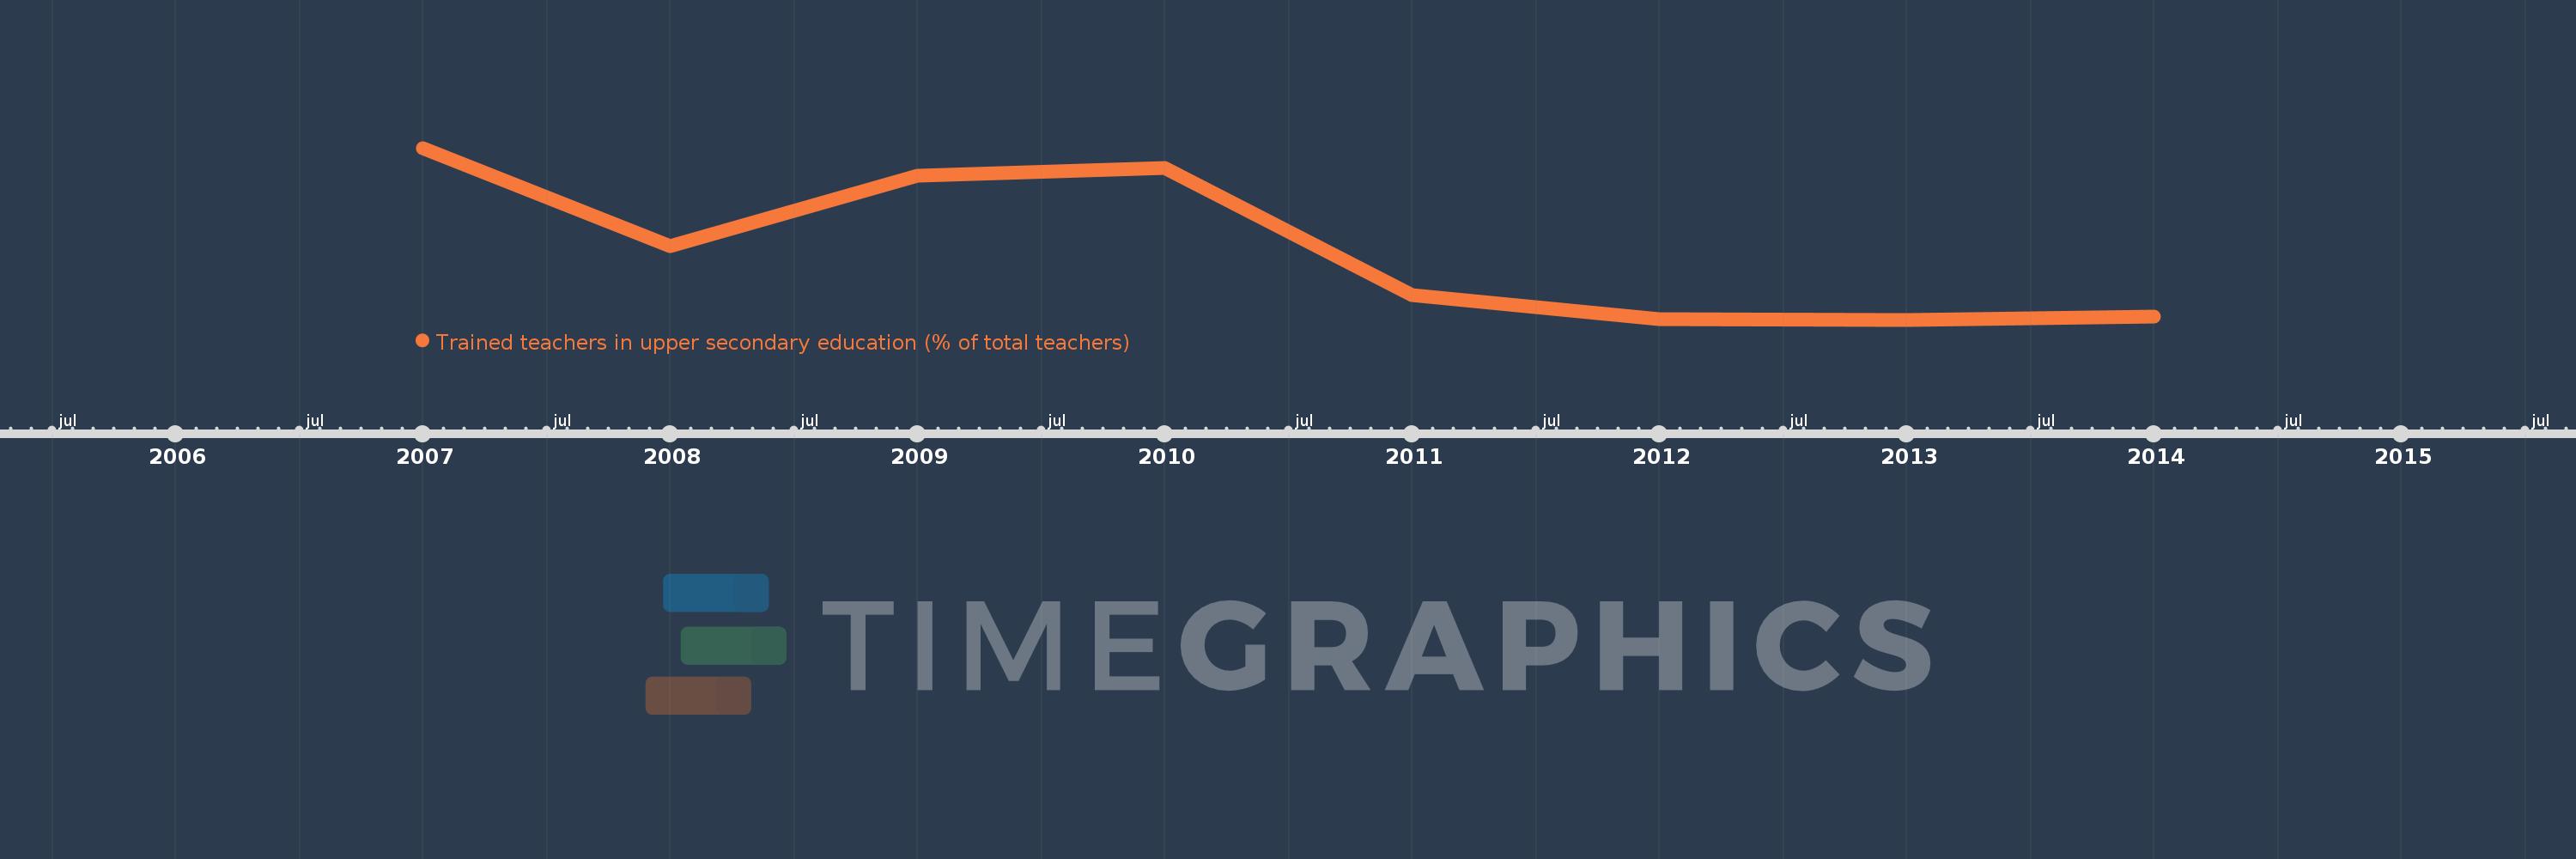
Questa scala temporale mostra un grafico dal 2007 anno al 2014 anno. Sub-Saharan Africa . I dati fino ad 2006 anno non disponibili. Il numero di osservazioni attuali secondo i date: 8.
La fonte (nome):
Indicatori dello sviluppo mondiale
La fonte (organizzazione):
United Nations Educational, Scientific, and Cultural Organization (UNESCO) Institute for Statistics.
Categorie:
Education
sono stati aggiornati
23 apr 2017 anni
Indicatori delle variazioni dei valori per anni
In media:
59.008
Minima:
51.002
1 gen 2013 anni
Massimo:
70.32
1 gen 2007 anni
Alla data di osservazione
Valore
Variazione assoluta
La variazione rispetto al valore precedente
1 gen 2007 anni
70.32
+70.32
0.0%
1 gen 2008 anni
59.309
-11.012
-15.66%
1 gen 2009 anni
67.191
+7.882
13.29%
1 gen 2010 anni
68.073
+0.882
1.31%
1 gen 2011 anni
53.734
-14.339
-21.06%
1 gen 2012 anni
51.077
-2.657
-4.95%
1 gen 2013 anni
51.002
-0.075
-0.15%
1 gen 2014 anni
51.362
+0.36
0.71%
Classificazione dei paesi secondo i statistiche attuali per anni