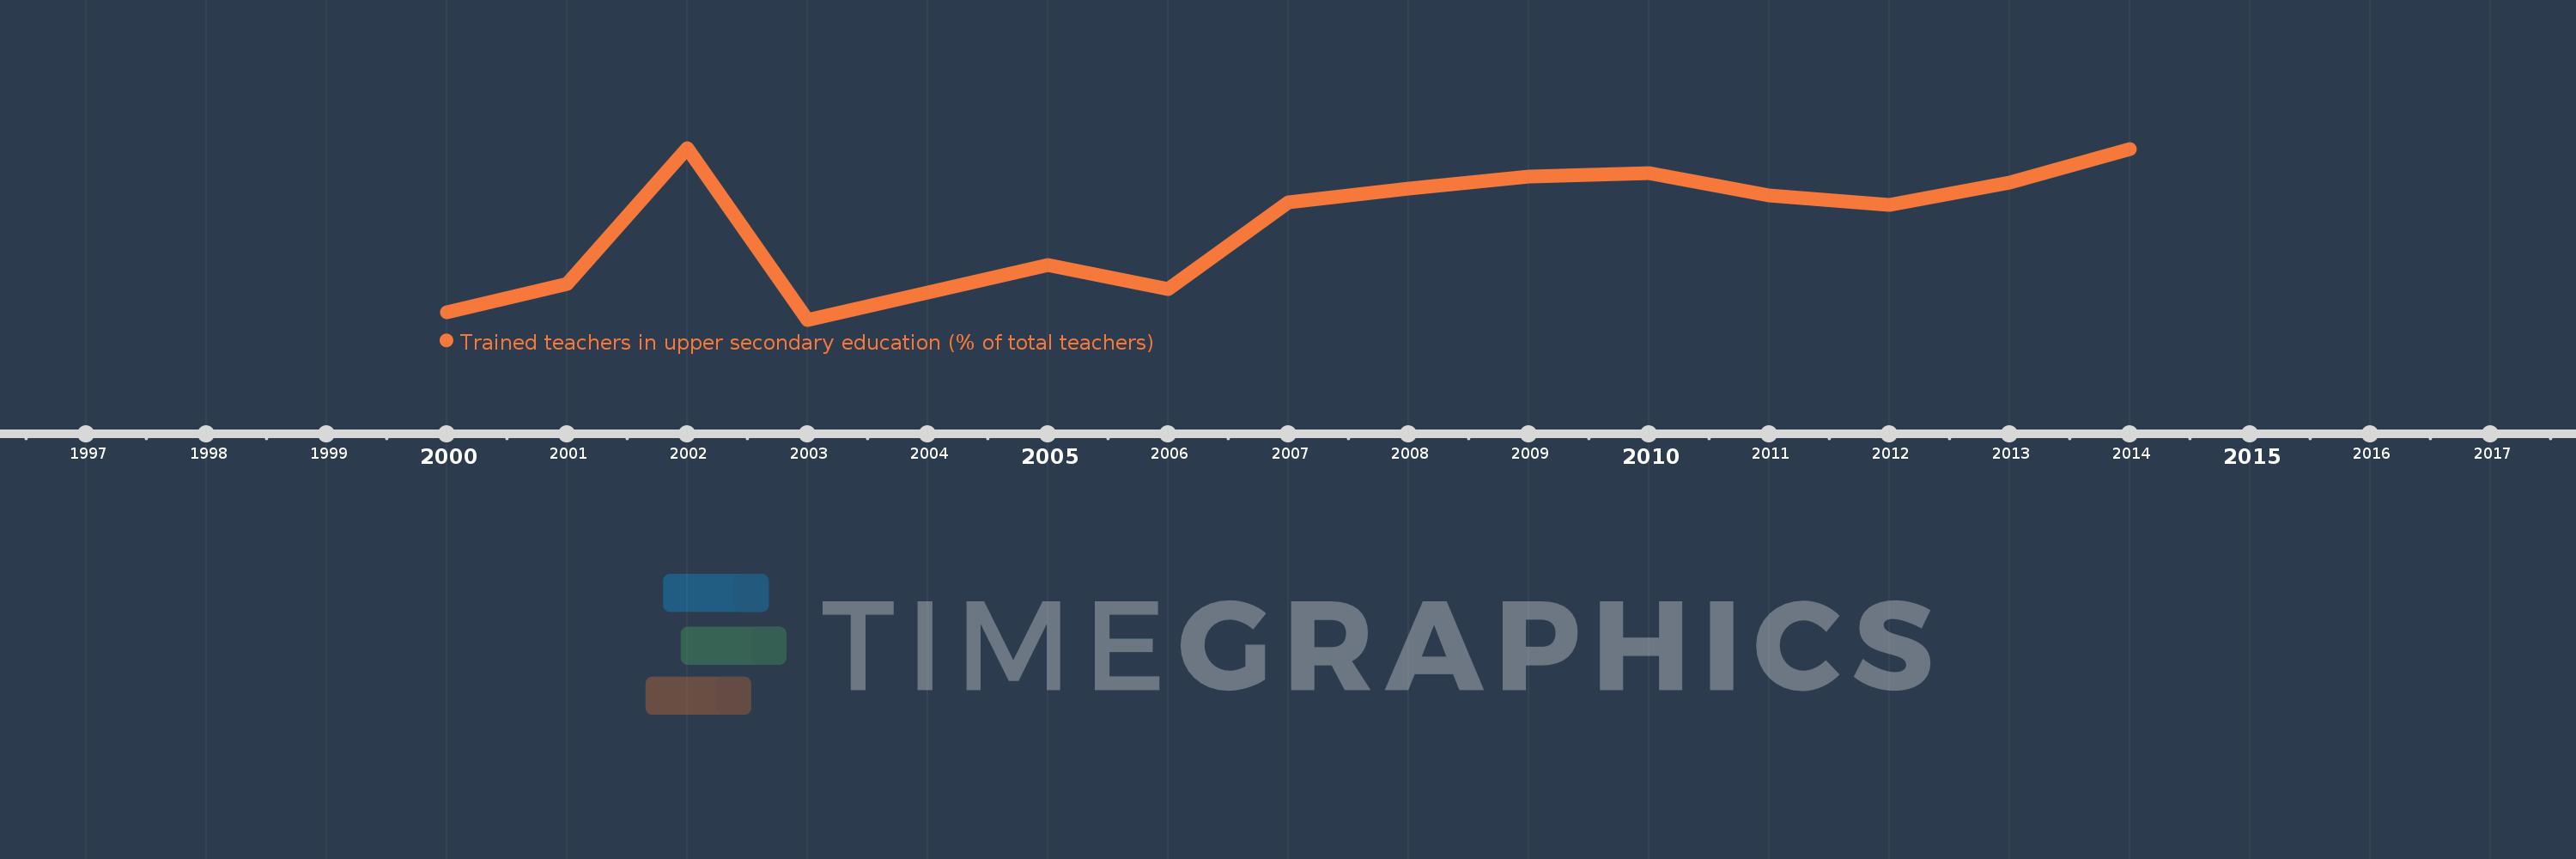
Questa scala temporale mostra un grafico dal 2000 anno al 2014 anno. Panama. I dati fino ad 1999 anno non disponibili. Il numero di osservazioni attuali secondo i date: 14.
La fonte (nome):
Indicatori dello sviluppo mondiale
La fonte (organizzazione):
United Nations Educational, Scientific, and Cultural Organization (UNESCO) Institute for Statistics.
Categorie:
Education
sono stati aggiornati
23 apr 2017 anni
Indicatori delle variazioni dei valori per anni
In media:
88.885
Minima:
81.28
1 gen 2003 anni
Massimo:
94.482
1 gen 2002 anni
Alla data di osservazione
Valore
Variazione assoluta
La variazione rispetto al valore precedente
1 gen 2000 anni
81.824
+81.824
0.0%
1 gen 2001 anni
84.06
+2.236
2.73%
1 gen 2002 anni
94.482
+10.422
12.4%
1 gen 2003 anni
81.28
-13.202
-13.97%
1 gen 2005 anni
85.458
+4.178
5.14%
1 gen 2006 anni
83.61
-1.848
-2.16%
1 gen 2007 anni
90.275
+6.665
7.97%
1 gen 2008 anni
91.386
+1.111
1.23%
1 gen 2009 anni
92.261
+0.875
0.96%
1 gen 2010 anni
92.552
+0.291
0.32%
1 gen 2011 anni
90.864
-1.687
-1.82%
1 gen 2012 anni
90.118
-0.746
-0.82%
1 gen 2013 anni
91.812
+1.694
1.88%
1 gen 2014 anni
94.411
+2.599
2.83%
Classificazione dei paesi secondo i statistiche attuali per anni