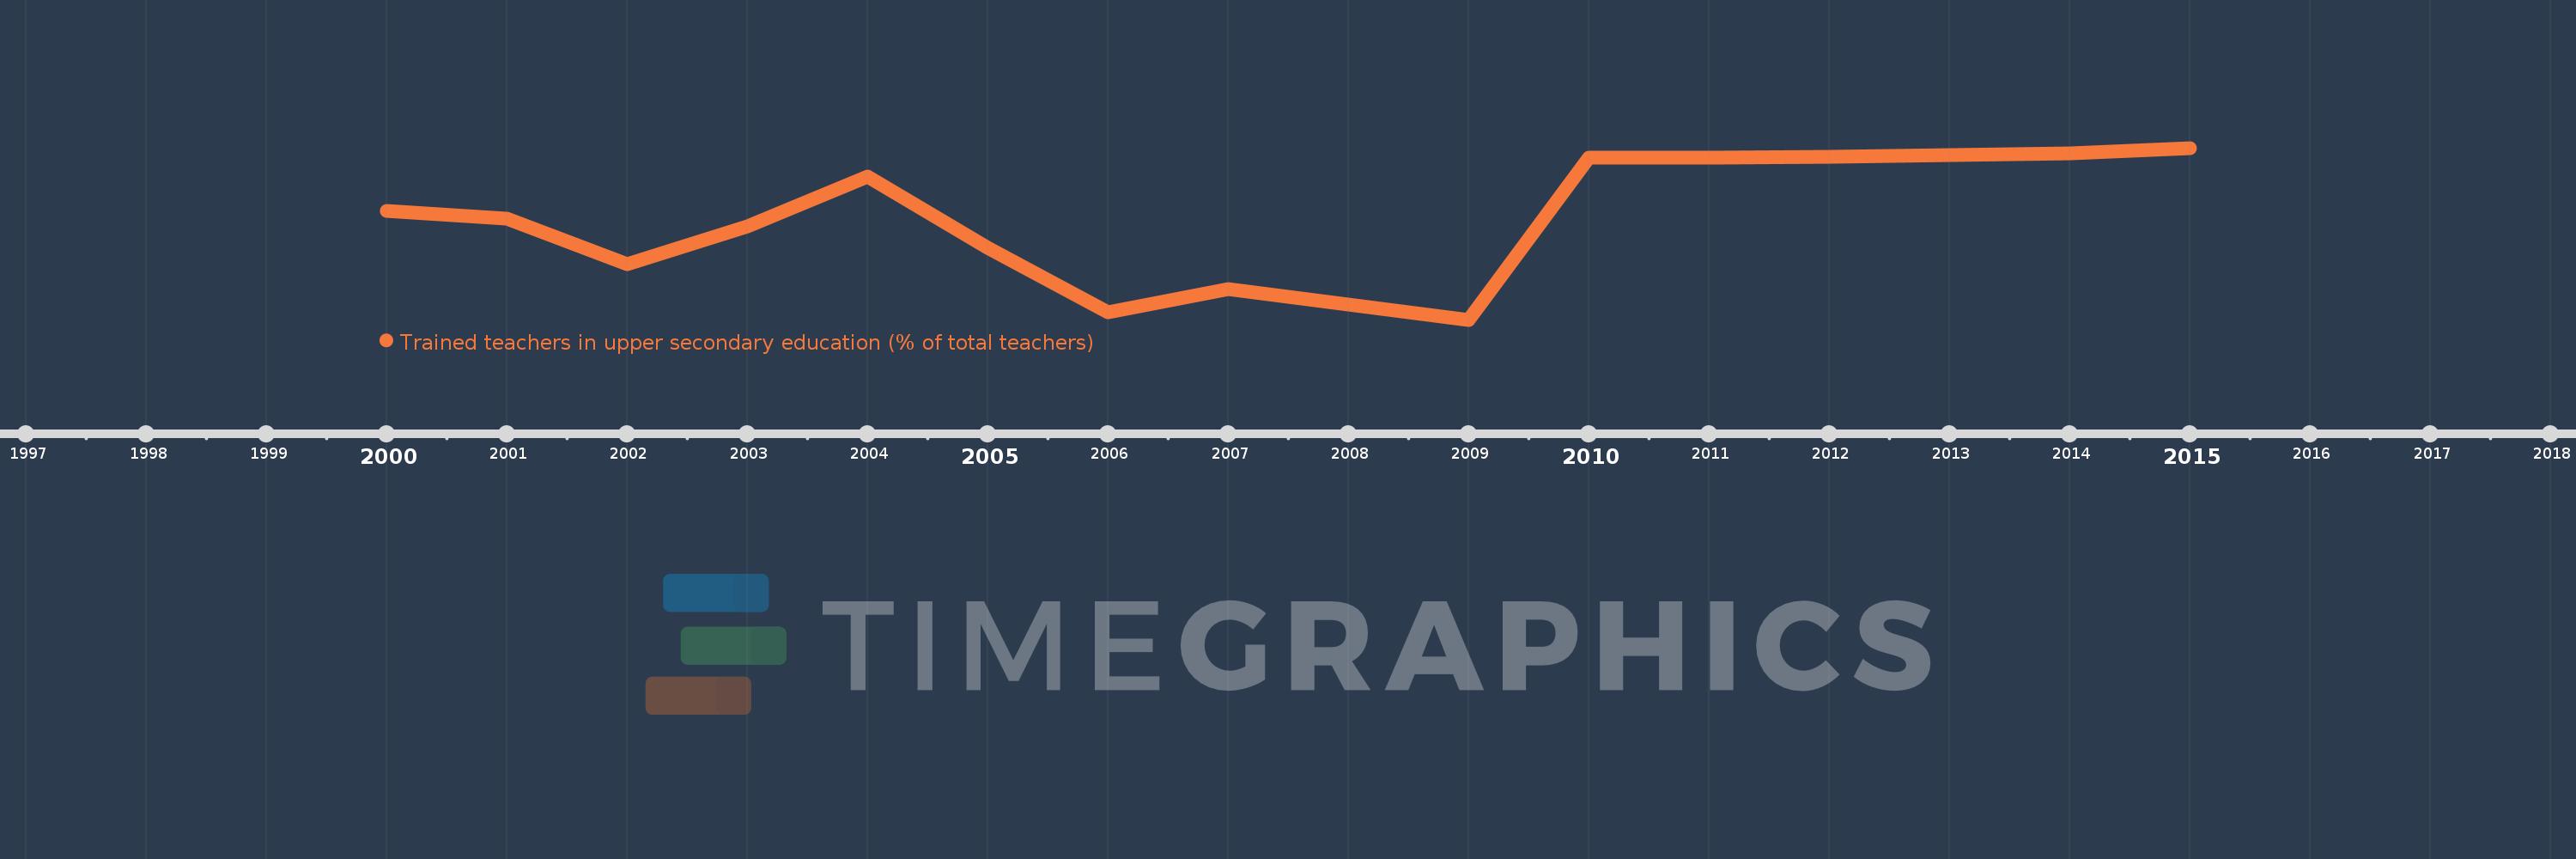
Questa scala temporale mostra un grafico dal 2000 anno al 2015 anno. Lao PDR. I dati fino ad 1999 anno non disponibili. Il numero di osservazioni attuali secondo i date: 15.
La fonte (nome):
Indicatori dello sviluppo mondiale
La fonte (organizzazione):
United Nations Educational, Scientific, and Cultural Organization (UNESCO) Institute for Statistics.
Categorie:
Education
sono stati aggiornati
23 apr 2017 anni
Indicatori delle variazioni dei valori per anni
In media:
95.933
Minima:
89.351
1 gen 2009 anni
Massimo:
99.936
1 gen 2015 anni
Alla data di osservazione
Valore
Variazione assoluta
La variazione rispetto al valore precedente
1 gen 2000 anni
96.055
+96.055
0.0%
1 gen 2001 anni
95.565
-0.489
-0.51%
1 gen 2002 anni
92.789
-2.776
-2.91%
1 gen 2003 anni
95.098
+2.309
2.49%
1 gen 2004 anni
98.184
+3.086
3.24%
1 gen 2005 anni
93.772
-4.411
-4.49%
1 gen 2006 anni
89.814
-3.959
-4.22%
1 gen 2007 anni
91.222
+1.408
1.57%
1 gen 2009 anni
89.351
-1.871
-2.05%
1 gen 2010 anni
99.336
+9.985
11.17%
1 gen 2011 anni
99.355
+0.019
0.02%
1 gen 2012 anni
99.417
+0.062
0.06%
1 gen 2013 anni
99.482
+0.065
0.07%
1 gen 2014 anni
99.625
+0.143
0.14%
1 gen 2015 anni
99.936
+0.311
0.31%
Classificazione dei paesi secondo i statistiche attuali per anni