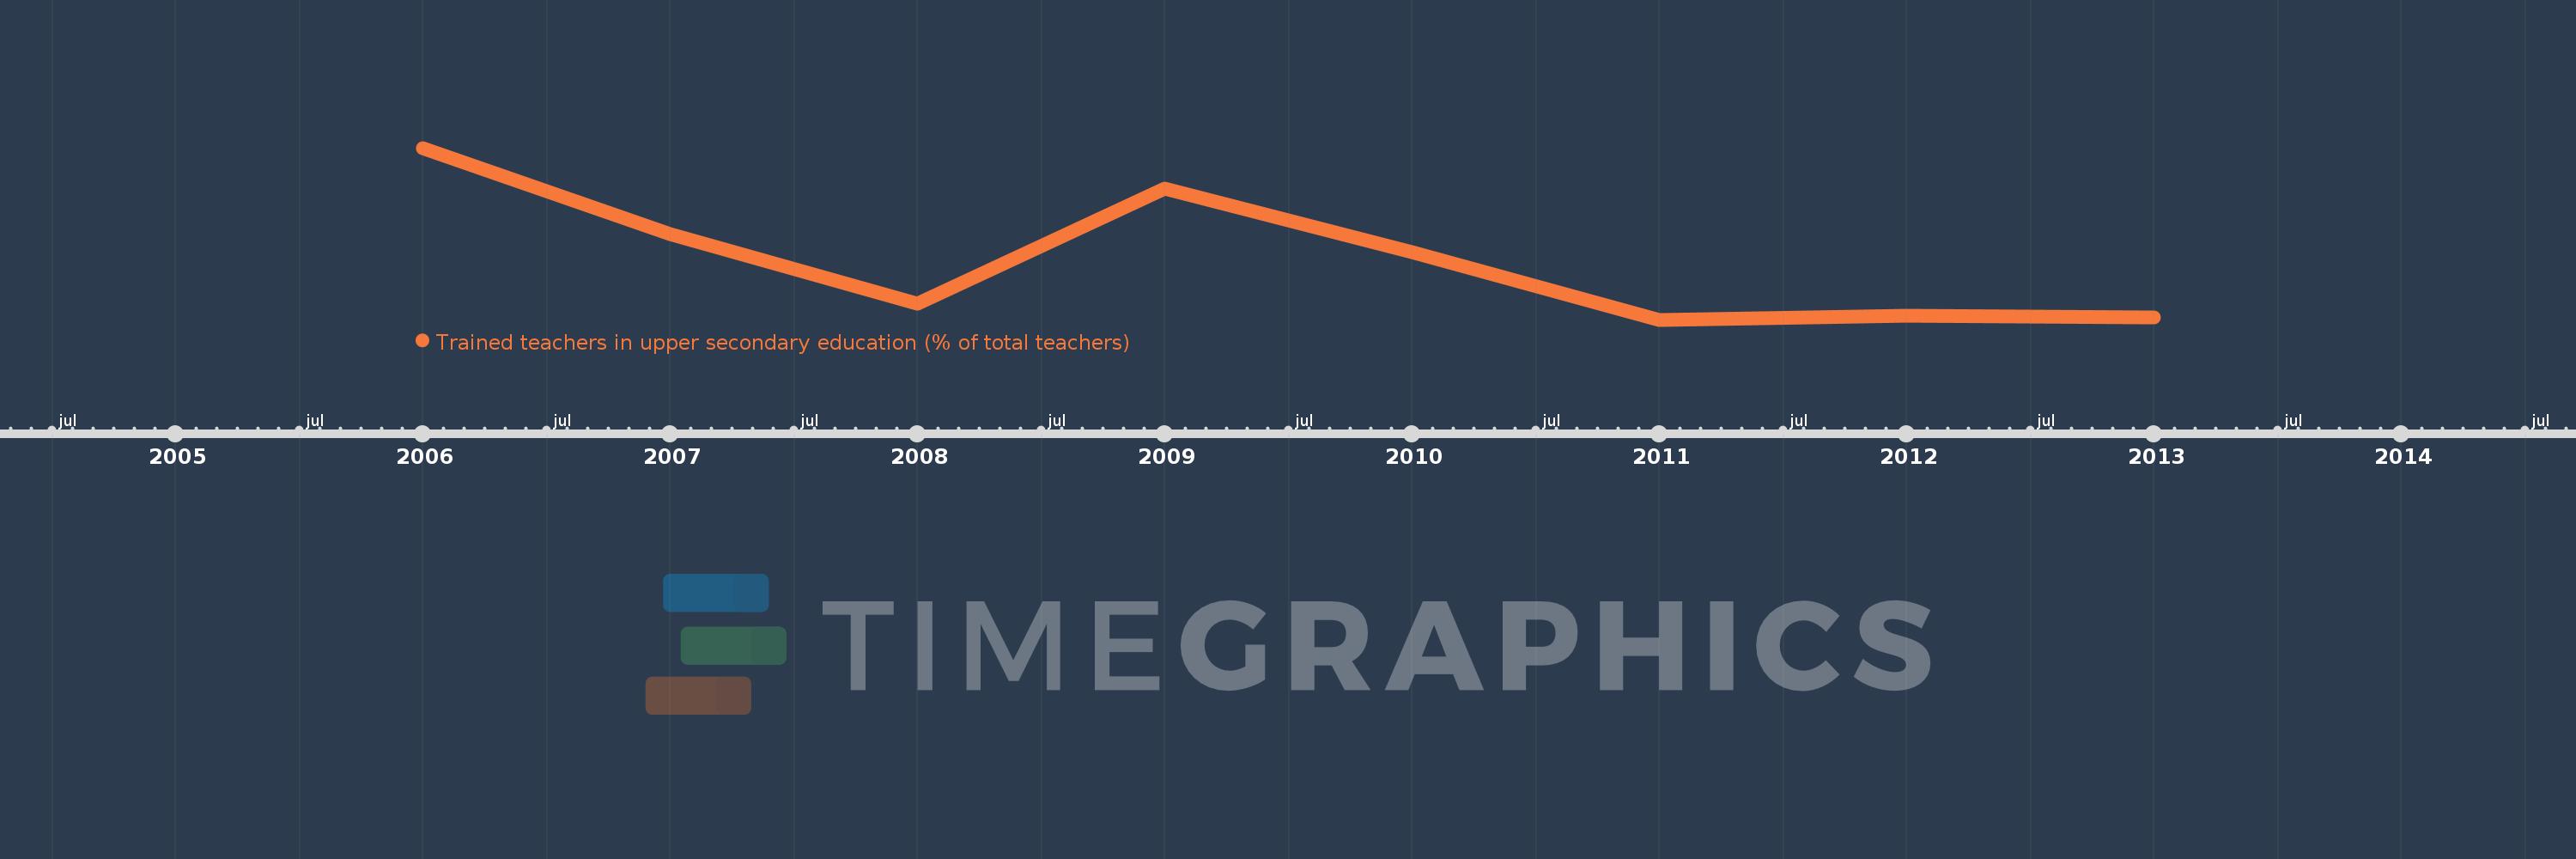
Questa scala temporale mostra un grafico dal 2006 anno al 2013 anno. IDA blend. I dati fino ad 2005 anno non disponibili. Il numero di osservazioni attuali secondo i date: 8.
La fonte (nome):
Indicatori dello sviluppo mondiale
La fonte (organizzazione):
United Nations Educational, Scientific, and Cultural Organization (UNESCO) Institute for Statistics.
Categorie:
Education
sono stati aggiornati
23 apr 2017 anni
Indicatori delle variazioni dei valori per anni
In media:
76.789
Minima:
71.155
1 gen 2011 anni
Massimo:
87.361
1 gen 2006 anni
Alla data di osservazione
Valore
Variazione assoluta
La variazione rispetto al valore precedente
1 gen 2006 anni
87.361
+87.361
0.0%
1 gen 2007 anni
79.212
-8.149
-9.33%
1 gen 2008 anni
72.642
-6.57
-8.29%
1 gen 2009 anni
83.52
+10.878
14.97%
1 gen 2010 anni
77.504
-6.016
-7.2%
1 gen 2011 anni
71.155
-6.349
-8.19%
1 gen 2012 anni
71.54
+0.385
0.54%
1 gen 2013 anni
71.382
-0.158
-0.22%
Classificazione dei paesi secondo i statistiche attuali per anni