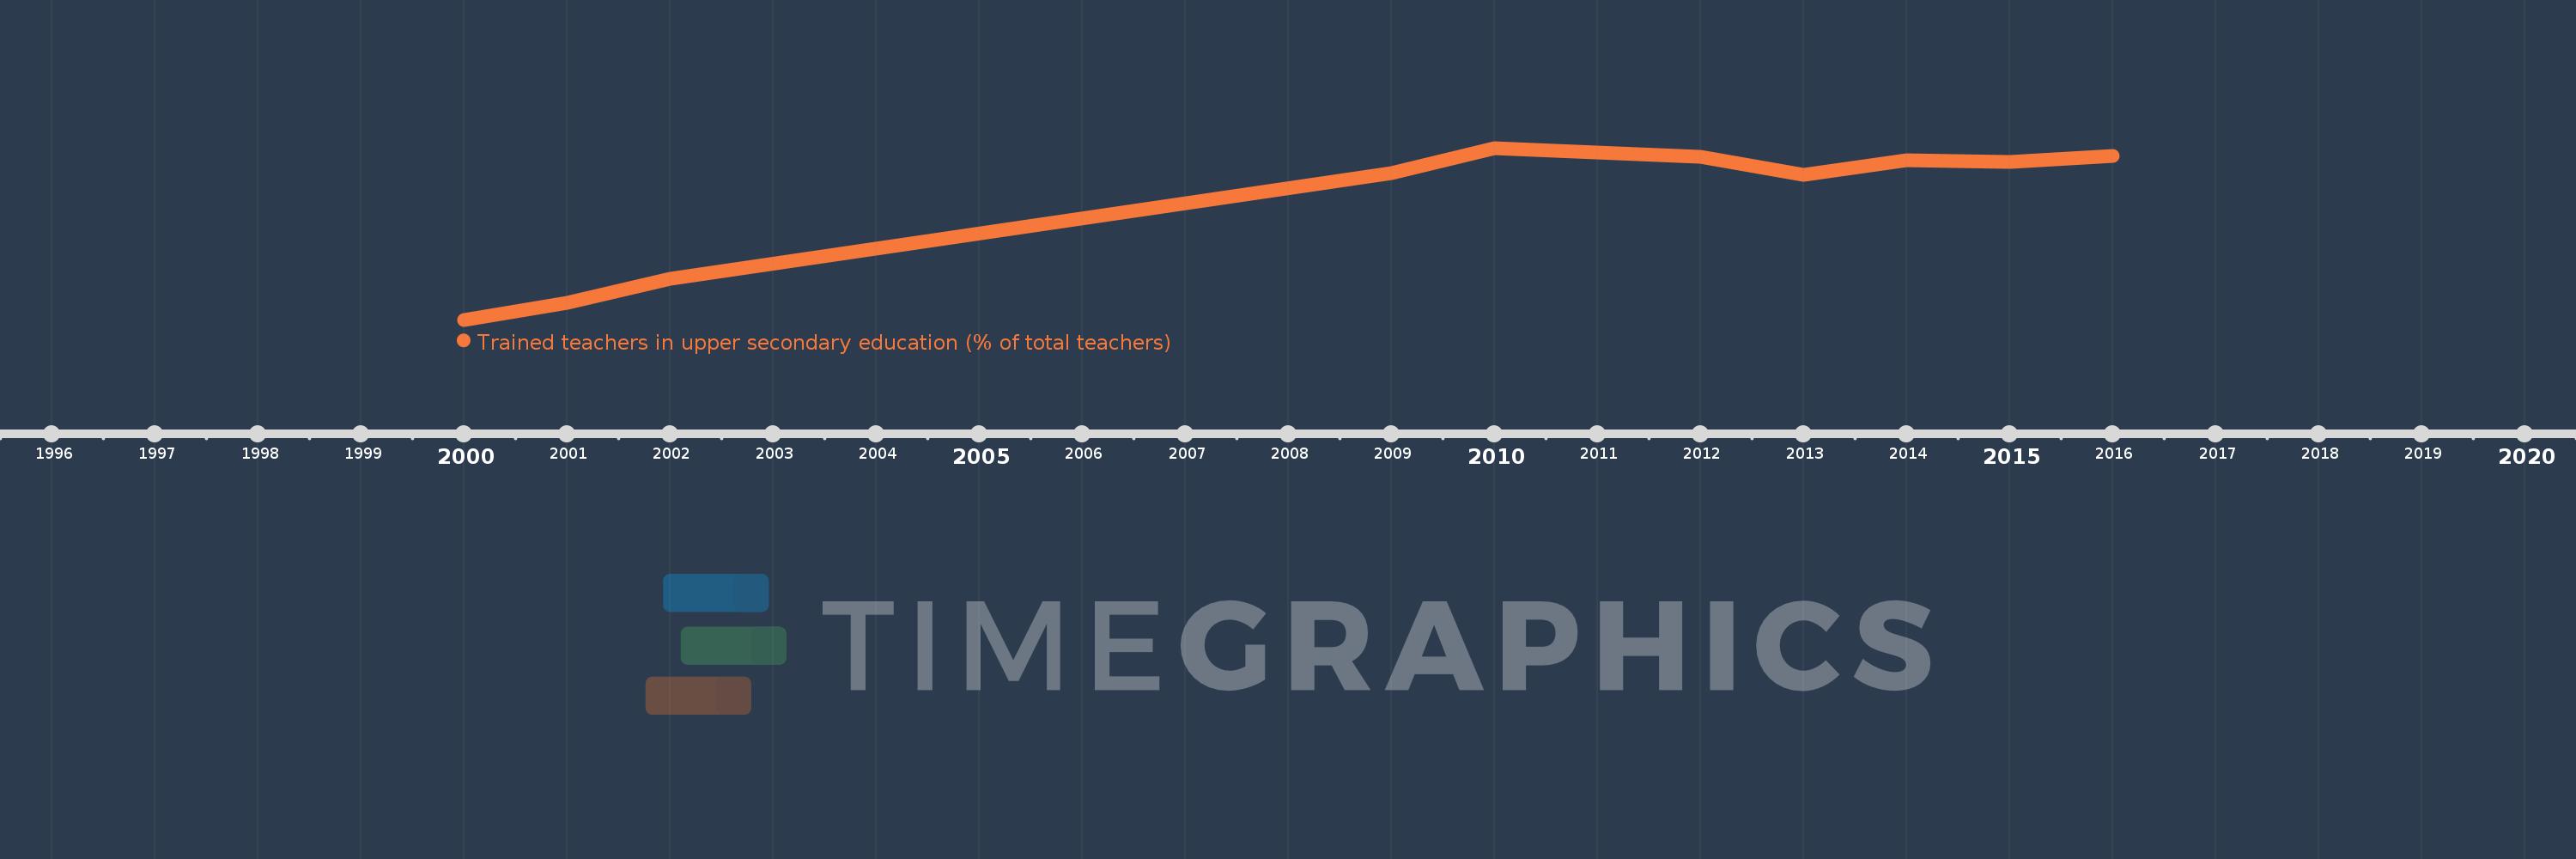
Questa scala temporale mostra un grafico dal 2000 anno al 2016 anno. Ghana. I dati fino ad 1999 anno non disponibili. Il numero di osservazioni attuali secondo i date: 10.
La fonte (nome):
Indicatori dello sviluppo mondiale
La fonte (organizzazione):
United Nations Educational, Scientific, and Cultural Organization (UNESCO) Institute for Statistics.
Categorie:
Education
sono stati aggiornati
23 apr 2017 anni
Indicatori delle variazioni dei valori per anni
In media:
71.642
Minima:
43.962
1 gen 2000 anni
Massimo:
84.77
1 gen 2010 anni
Alla data di osservazione
Valore
Variazione assoluta
La variazione rispetto al valore precedente
1 gen 2000 anni
43.962
+43.962
0.0%
1 gen 2001 anni
48.067
+4.104
9.34%
1 gen 2002 anni
53.791
+5.725
11.91%
1 gen 2009 anni
78.864
+25.072
46.61%
1 gen 2010 anni
84.77
+5.907
7.49%
1 gen 2012 anni
82.631
-2.139
-2.52%
1 gen 2013 anni
78.287
-4.345
-5.26%
1 gen 2014 anni
81.814
+3.527
4.51%
1 gen 2015 anni
81.353
-0.461
-0.56%
1 gen 2016 anni
82.878
+1.526
1.88%
Classificazione dei paesi secondo i statistiche attuali per anni