Questa scala temporale mostra un grafico dal 1999 anno al 2015 anno. IDA only. I dati fino ad 1998 anno non disponibili. Il numero di osservazioni attuali secondo i date: 17.
La fonte (nome):
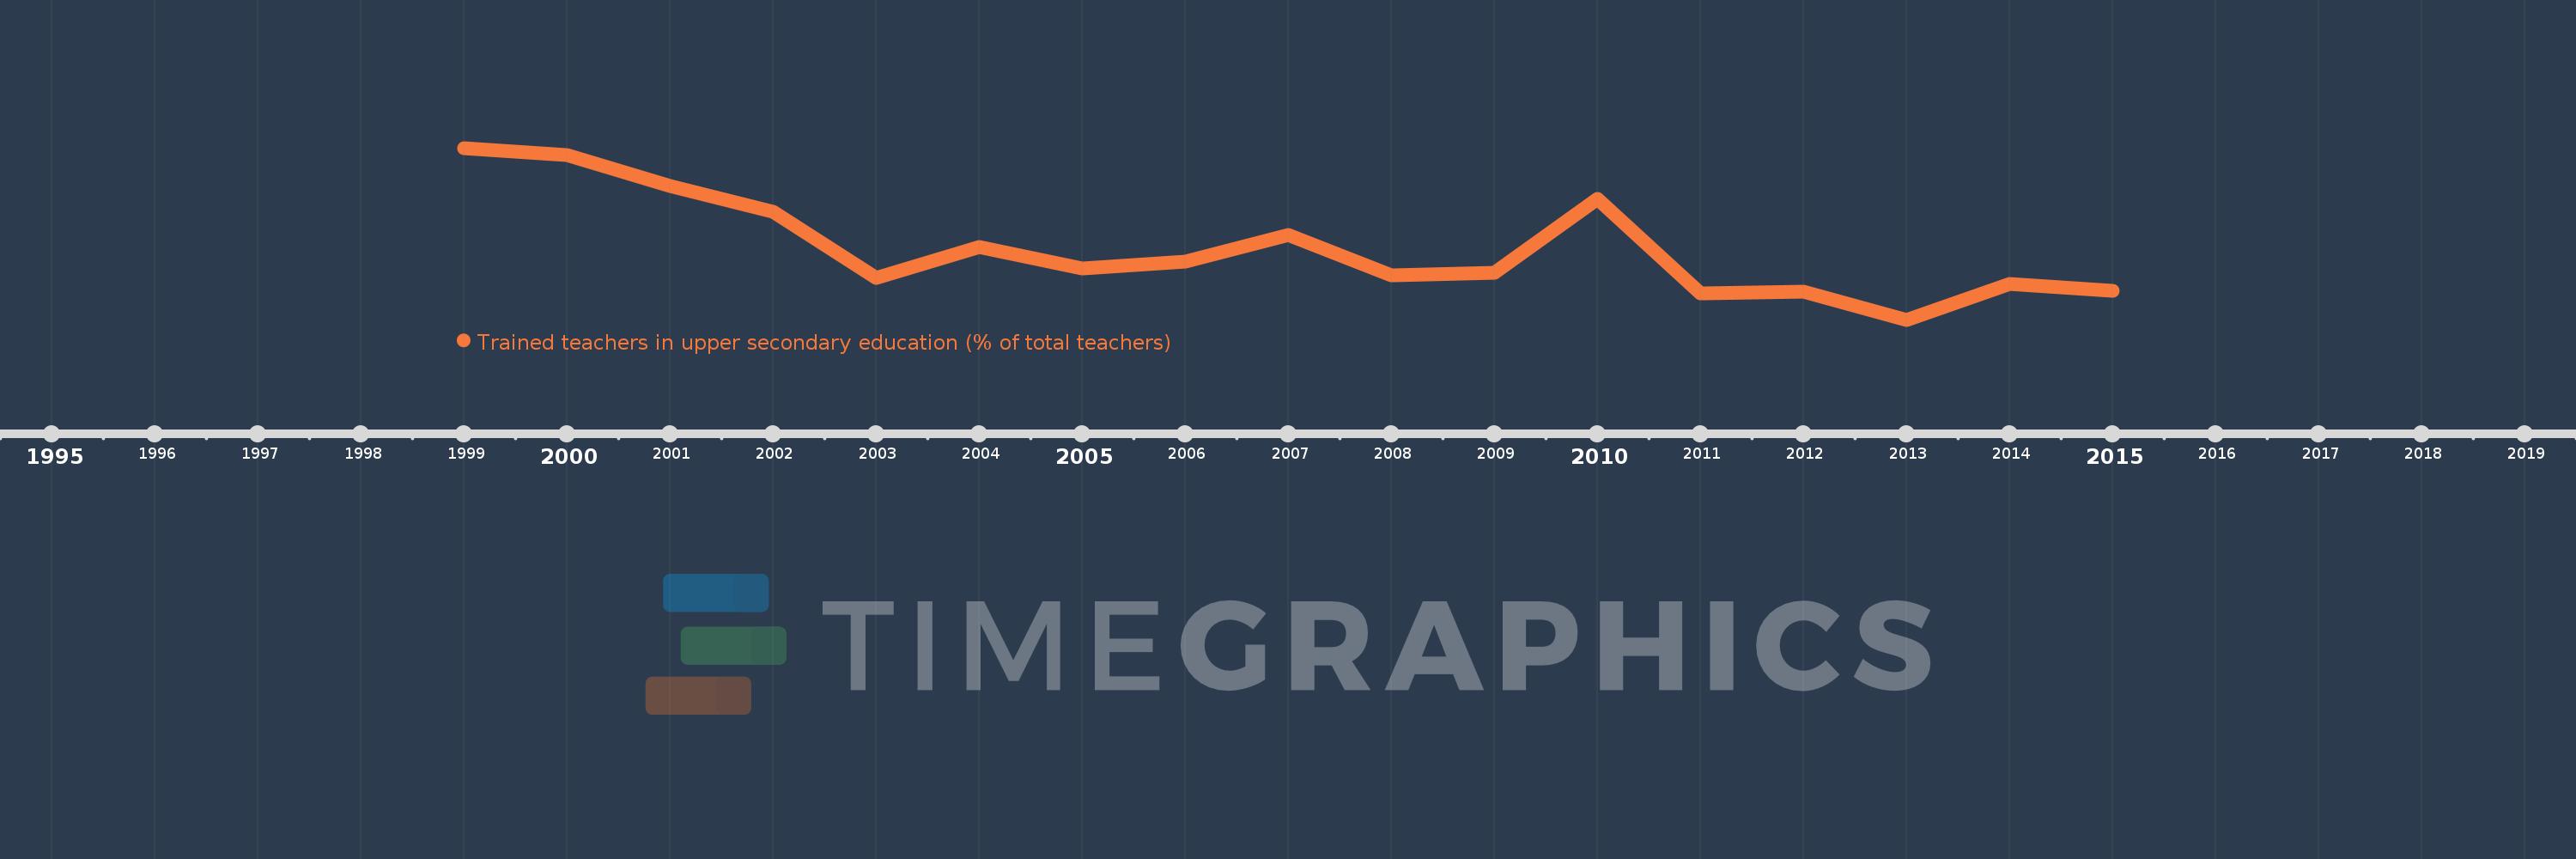
Indicatori dello sviluppo mondiale
La fonte (organizzazione):
United Nations Educational, Scientific, and Cultural Organization (UNESCO) Institute for Statistics.
Categorie:
Education
sono stati aggiornati
23 apr 2017 anni
Indicatori delle variazioni dei valori per anni
In media:
56.365
Minima:
51.498
1 gen 2013 anni
Massimo:
63.178
1 gen 1999 anni
Alla data di osservazione
Valore
Variazione assoluta
La variazione rispetto al valore precedente
1 gen 1999 anni
63.178
+63.178
0.0%
1 gen 2000 anni
62.684
-0.494
-0.78%
1 gen 2001 anni
60.567
-2.117
-3.38%
1 gen 2002 anni
58.848
-1.719
-2.84%
1 gen 2003 anni
54.338
-4.51
-7.66%
1 gen 2004 anni
56.427
+2.089
3.84%
1 gen 2005 anni
54.979
-1.448
-2.57%
1 gen 2006 anni
55.443
+0.464
0.84%
1 gen 2007 anni
57.265
+1.822
3.29%
1 gen 2008 anni
54.501
-2.763
-4.83%
1 gen 2009 anni
54.693
+0.192
0.35%
1 gen 2010 anni
59.713
+5.02
9.18%
1 gen 2011 anni
53.289
-6.425
-10.76%
1 gen 2012 anni
53.389
+0.1
0.19%
1 gen 2013 anni
51.498
-1.891
-3.54%
1 gen 2014 anni
53.926
+2.428
4.71%
1 gen 2015 anni
53.469
-0.457
-0.85%
Classificazione dei paesi secondo i statistiche attuali per anni