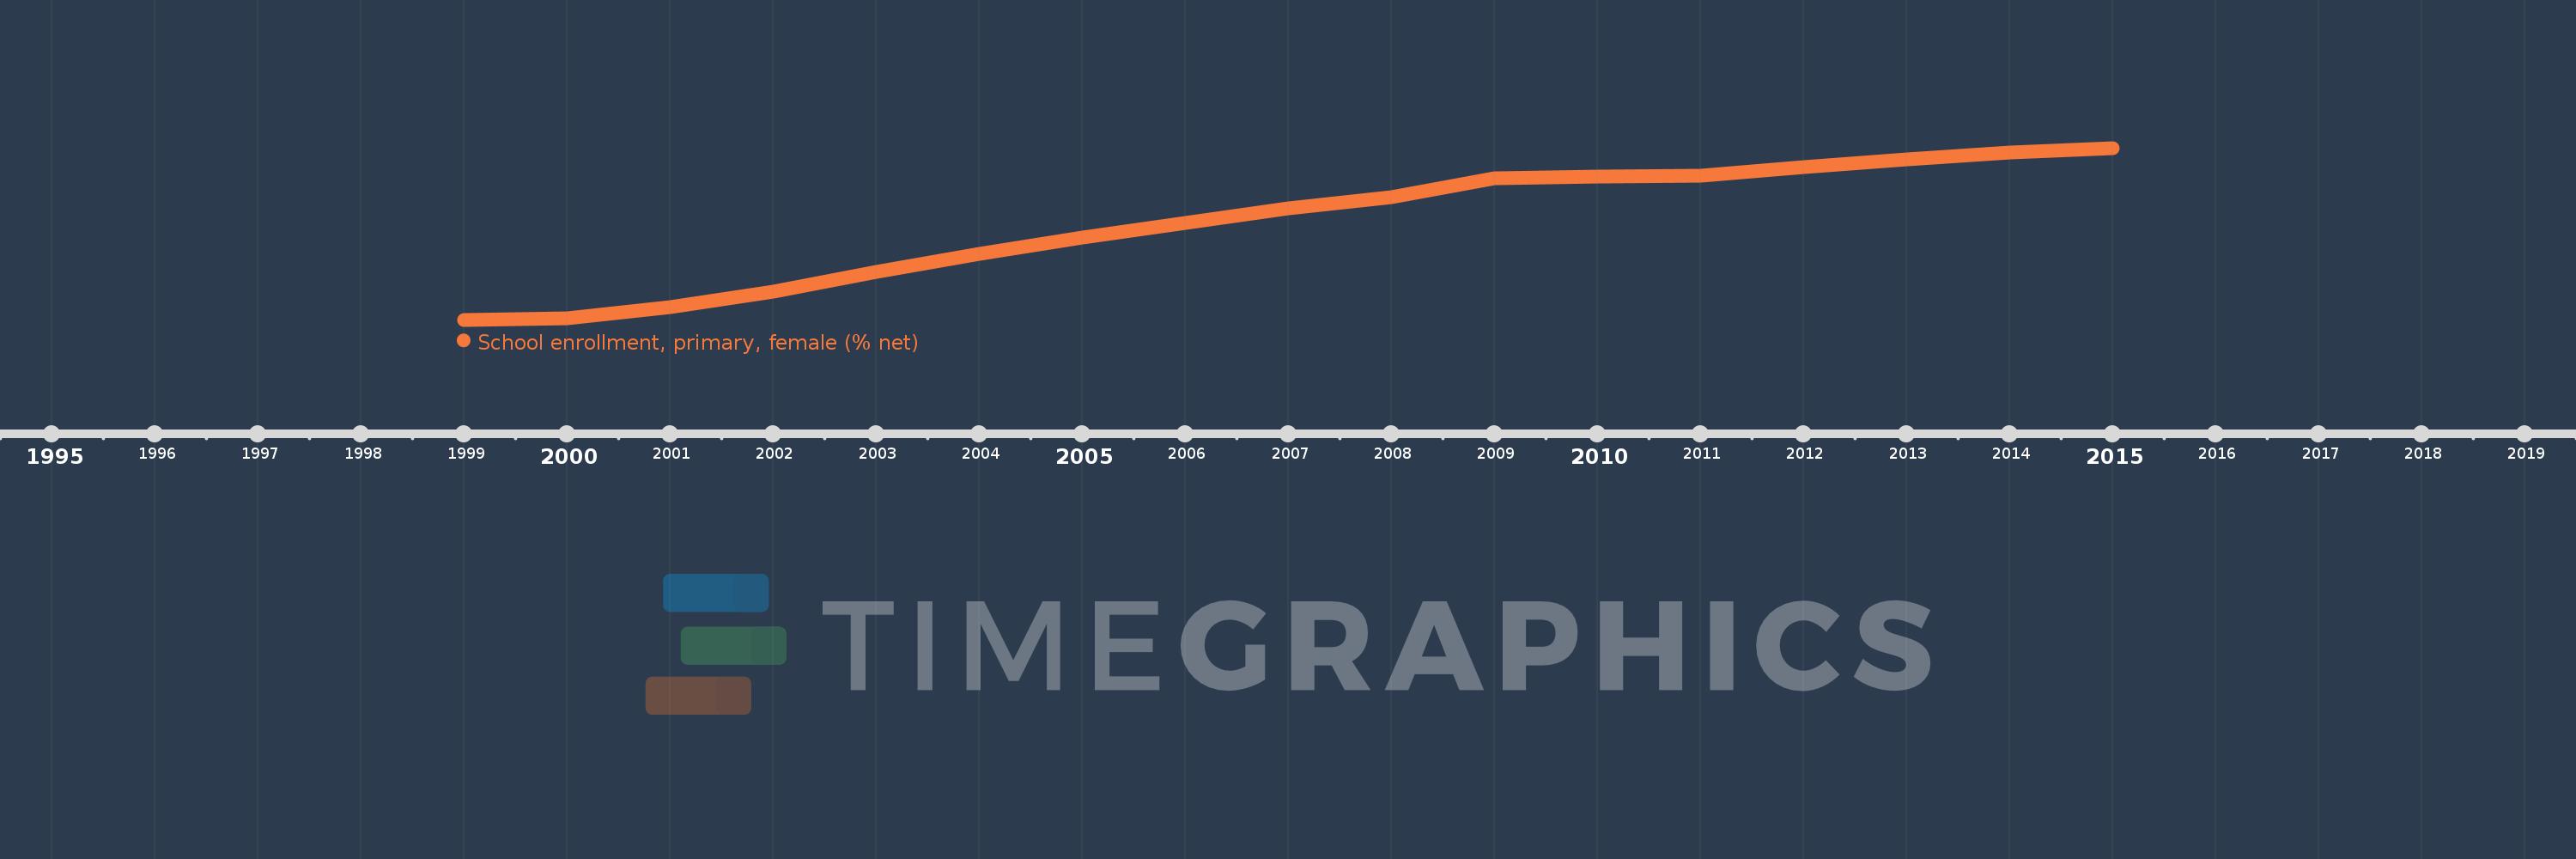
Questa scala temporale mostra un grafico dal 1999 anno al 2015 anno. Heavily indebted poor countries (HIPC). I dati fino ad 1998 anno non disponibili. Il numero di osservazioni attuali secondo i date: 17.
La fonte (nome):
Indicatori dello sviluppo mondiale
La fonte (organizzazione):
United Nations Educational, Scientific, and Cultural Organization (UNESCO) Institute for Statistics.
Categorie:
Education, Gender
sono stati aggiornati
23 apr 2017 anni
Indicatori delle variazioni dei valori per anni
In media:
64.453
Minima:
47.169
1 gen 1999 anni
Massimo:
77.786
1 gen 2015 anni
Alla data di osservazione
Valore
Variazione assoluta
La variazione rispetto al valore precedente
1 gen 1999 anni
47.169
+47.169
0.0%
1 gen 2000 anni
47.453
+0.284
0.6%
1 gen 2001 anni
49.409
+1.956
4.12%
1 gen 2002 anni
52.099
+2.69
5.44%
1 gen 2003 anni
55.708
+3.609
6.93%
1 gen 2004 anni
58.864
+3.157
5.67%
1 gen 2005 anni
61.784
+2.92
4.96%
1 gen 2006 anni
64.439
+2.655
4.3%
1 gen 2007 anni
67.056
+2.616
4.06%
1 gen 2008 anni
69.007
+1.952
2.91%
1 gen 2009 anni
72.443
+3.436
4.98%
1 gen 2010 anni
72.691
+0.249
0.34%
1 gen 2011 anni
72.839
+0.148
0.2%
1 gen 2012 anni
74.323
+1.484
2.04%
1 gen 2013 anni
75.678
+1.355
1.82%
1 gen 2014 anni
76.948
+1.271
1.68%
1 gen 2015 anni
77.786
+0.838
1.09%
Classificazione dei paesi secondo i statistiche attuali per anni