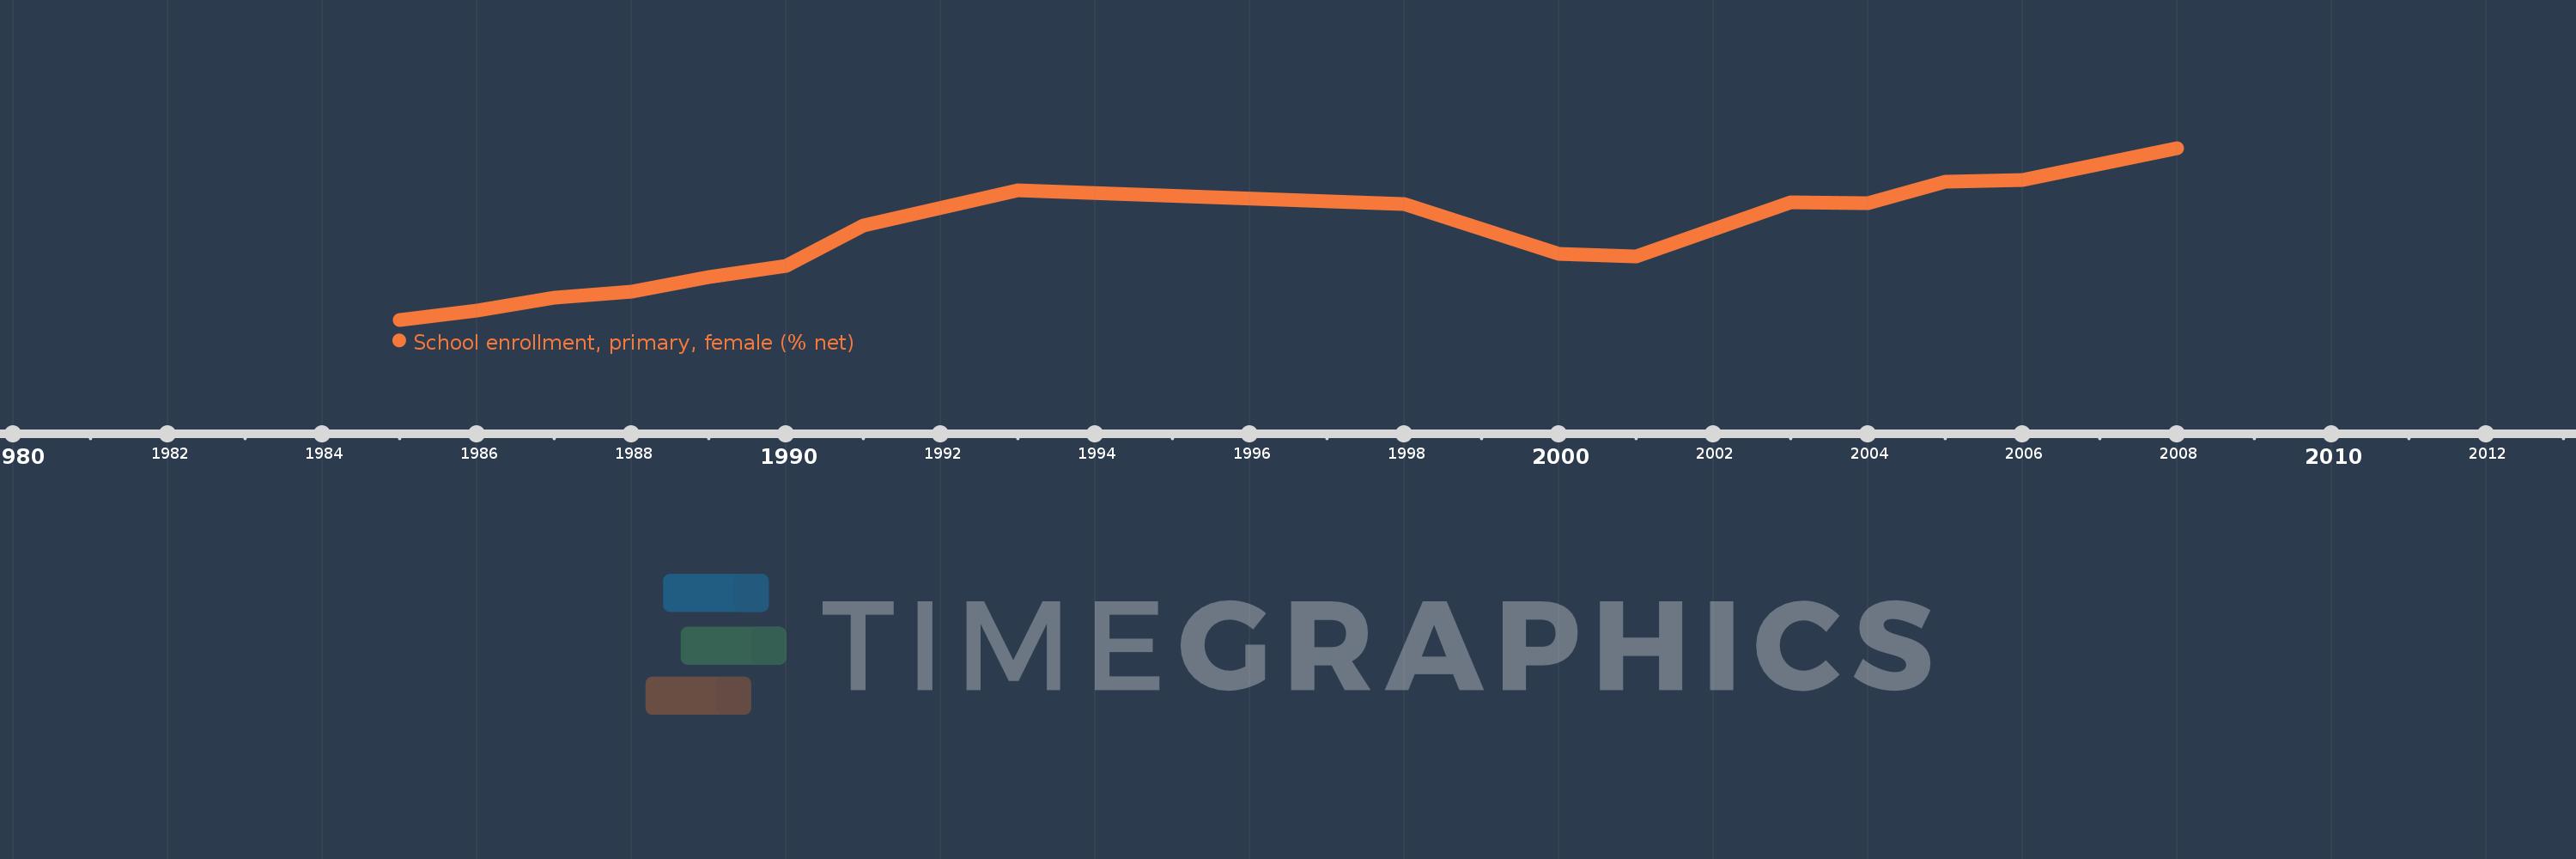
Questa scala temporale mostra un grafico dal 1985 anno al 2008 anno. Iran, Islamic Rep.. I dati fino ad 1984 anno non disponibili. Il numero di osservazioni attuali secondo i date: 16.
La fonte (nome):
Indicatori dello sviluppo mondiale
La fonte (organizzazione):
United Nations Educational, Scientific, and Cultural Organization (UNESCO) Institute for Statistics.
Categorie:
Education, Gender
sono stati aggiornati
23 apr 2017 anni
Indicatori delle variazioni dei valori per anni
In media:
86.399
Minima:
74.289
1 gen 1985 anni
Massimo:
99.729
1 gen 2008 anni
Alla data di osservazione
Valore
Variazione assoluta
La variazione rispetto al valore precedente
1 gen 1985 anni
74.289
+74.289
0.0%
1 gen 1986 anni
75.681
+1.392
1.87%
1 gen 1987 anni
77.609
+1.929
2.55%
1 gen 1988 anni
78.436
+0.827
1.07%
1 gen 1989 anni
80.612
+2.175
2.77%
1 gen 1990 anni
82.292
+1.68
2.08%
1 gen 1991 anni
88.22
+5.928
7.2%
1 gen 1993 anni
93.472
+5.252
5.95%
1 gen 1998 anni
91.397
-2.075
-2.22%
1 gen 2000 anni
83.995
-7.403
-8.1%
1 gen 2001 anni
83.657
-0.337
-0.4%
1 gen 2003 anni
91.711
+8.053
9.63%
1 gen 2004 anni
91.556
-0.155
-0.17%
1 gen 2005 anni
94.767
+3.211
3.51%
1 gen 2006 anni
94.963
+0.196
0.21%
1 gen 2008 anni
99.729
+4.765
5.02%
Classificazione dei paesi secondo i statistiche attuali per anni